Visual Spatial Intelligence
The term “visual-spatial intelligence” is most commonly associated with cognitive science. Howard Gardner described spatial intelligence as the ability to understand and visualize space. For example, finding your way through an unfamiliar place without a map or mentally picturing how an object would look if it were rotated. Is it possible to apply a similar definition when referring to systems and their ability to understand physical space well enough to make accurate decisions? In software, that capability comes from combining perception, 3D reconstruction, spatial memory, and spatial reasoning.
Today’s AI systems have made impressive progress, but this remains one of their biggest challenges. A model might accurately describe a warehouse photo, yet fail to answer practical questions such as:
- How far apart are the shelves?
- Will this pallet fit through the doorway?
- Which side of the column is the exit?
Benchmarks built for this gap, such as VSI-Bench, show multimodal models performing well at identifying what is in a scene while still struggling with metric distance, object size, and relative direction.
And the gap matters more than ever. Applications in robotics, augmented reality, digital twins, autonomous vehicles, and industrial inspection all depend on a machine understanding real-world geometry, not just recognizing what appears in an image.
This article covers what visual spatial intelligence means from an engineering perspective, why current AI models struggle with spatial reasoning, and how production systems solve the problem using geometry, spatial data, and structured reasoning instead of relying on language models alone.
Summary of key visual spatial intelligence concepts
The table below summarizes the five key concepts covered in this article.
| Concept | Description |
|---|---|
| What visual spatial intelligence means for a machine | A system-level capability combining perception, 3D reconstruction, spatial memory, and spatial reasoning, rather than a property of a single AI model. |
| Why vision-language models fail at spatial tasks | Flat images carry no depth or scale, and models process each frame independently, so no map of the space is ever built. |
| The visual spatial intelligence pipeline | Capture and 3D reconstruction produce the geometry, and the model reasons over queries against that geometry instead of over pixels. |
| Where visual spatial pipelines break | Production challenges are caused by coordinate systems, measurement units, registration errors, and missing spatial semantics, rather than model quality alone. |
| A real-world visual spatial intelligence workflow | An end-to-end inspection workflow illustrating how geometry, spatial data, and AI work together to produce accurate and auditable spatial decisions. |
What visual spatial intelligence means for a machine
Gardner’s definition in the introduction applies to people, but in engineering, it is not a capability of a single model but the result of four cooperating system layers. Each layer has a distinct responsibility and can be developed, evaluated, and replaced independently:
- Perception identifies what is in the scene.
- 3D reconstruction establishes where those things are and how large they are, in real-world units.
- Spatial memory keeps a single persistent record of the space, so an object seen from two viewpoints is recognized as one object rather than two.
- Spatial reasoning answers questions about the relationships among objects such as clearances, containment, adjacency, and route accessibility.
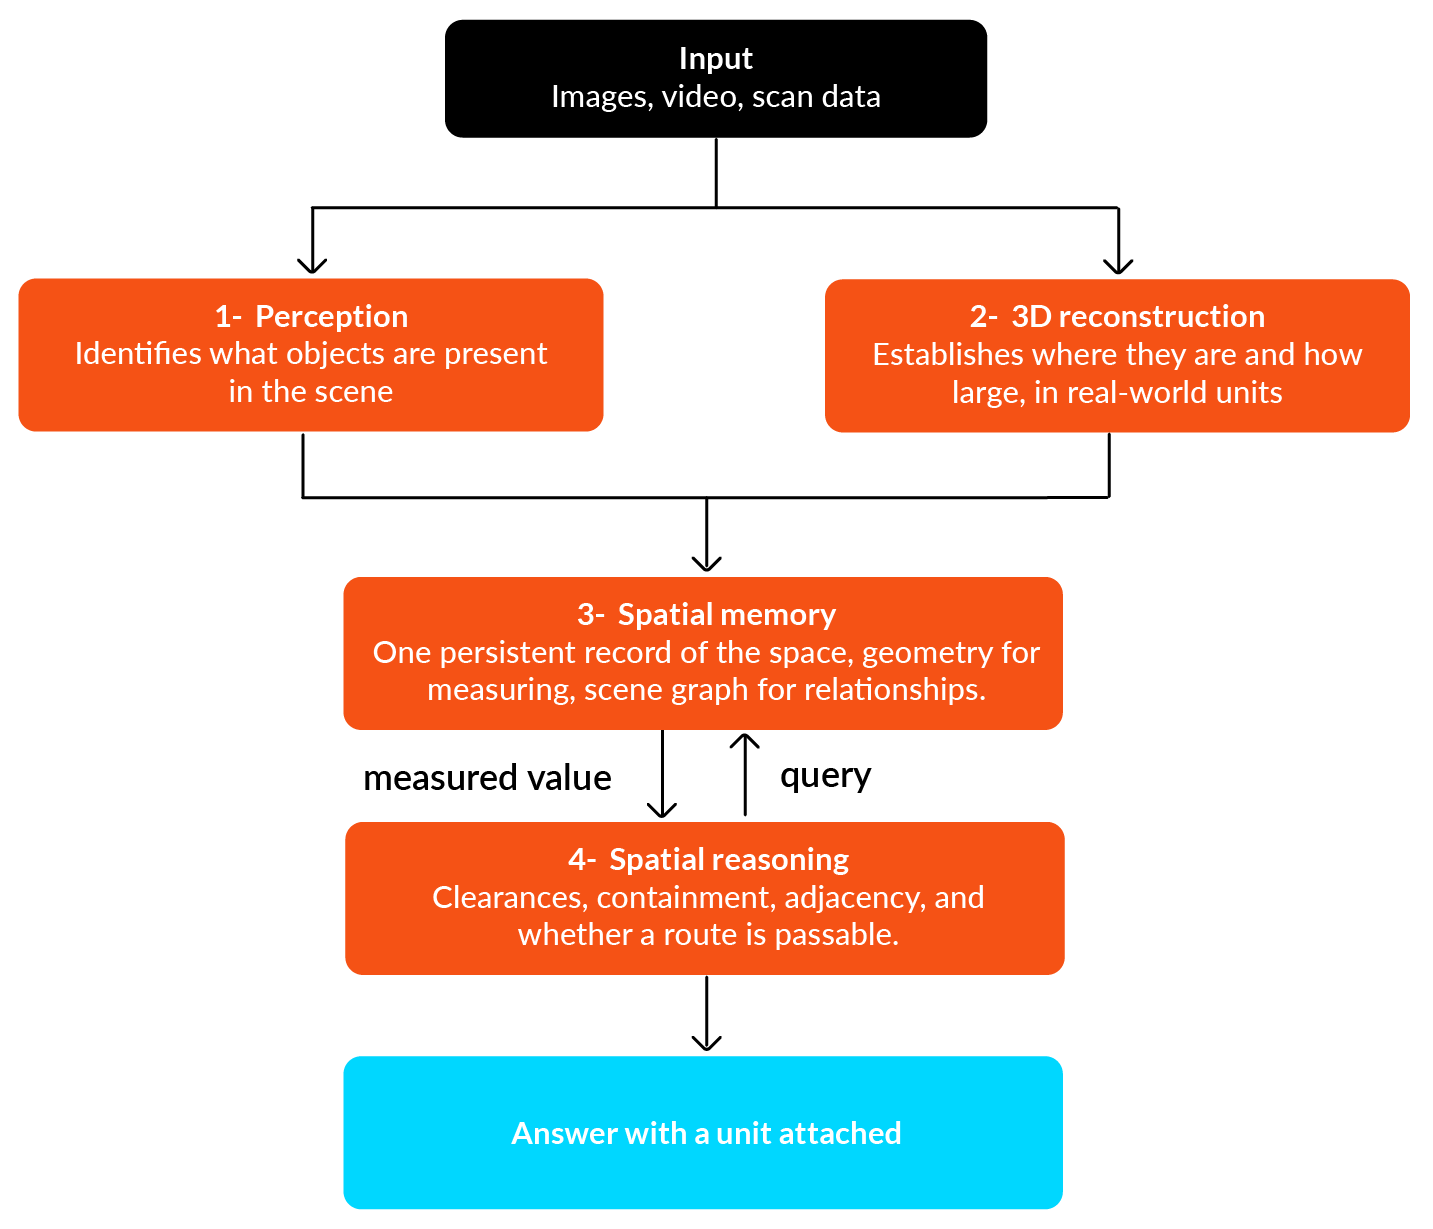
The important consequence is that a system can be excellent at the first layer and have nothing underneath it. That is exactly the situation most teams are in when they connect a camera to a vision-language model and start asking measurement questions that the system has no way to answer correctly.
This table provides a summary comparison of visual understanding (2D) vs. visual spatial intelligence (3D)
| Handled well by 2D vision-language models | Requires 3D spatial understanding |
|---|---|
| Identifying and labeling objects | Requires 3D spatial understanding |
| Recognizing scene or room type | Estimating object or room dimensions |
| Describing an image in natural language | Determining whether one object blocks another |
| Reading text and signage | Deciding whether a clearance or route is passable |
| Detecting object presence or absence | Counting objects consistently across many views |
This gives a working definition to use for the rest of the article. If answering a question requires a real-world measurement, the system needs visual spatial intelligence, not just visual understanding.
Why vision-language models fail at spatial tasks
A camera captures a three-dimensional world as a two-dimensional image, losing depth information in the process. From a single uncalibrated image, the true size and distance of objects cannot be determined. For example, a chair one meter away and a doll’s chair ten centimeters away can produce identical images, with nothing in the image alone revealing which is correct. Scale has to come from somewhere else, like a second view with a known baseline, a depth sensor, or an object of known size in the frame.
The second challenge is spatial memory. Most models process video frame by frame without maintaining a persistent representation of the environment. As a result, they struggle to connect the same object across different viewpoints. This is why counting objects in a walkthrough video is much harder than it appears. The difficulty isn’t recognizing the objects, it is remembering which ones have already been seen as the camera moves through space.
The way these models are trained makes the problem even harder. Most image-caption datasets teach models what objects are and how they look, but don’t really include information about distance, size, or spatial relationships. As a result, models can rely on non-visual shortcuts rather than reasoning from the visual input. There is direct evidence for this. VSI-Bench-Debiased removes questions that are especially vulnerable to these shortcuts, and models show lower performance on the debiased benchmark. This suggests that some performance on the original benchmark came from using non-visual patterns rather than spatial reasoning.
Benchmark results tell a consistent story. On VSI-Bench, which contains more than 5,000 questions across 288 real indoor video sequences, human annotators achieved an accuracy of 79.2%. By comparison, the best proprietary model in the original evaluation scored 48.8%, while GPT-4o reached 34.0%. More importantly, the authors found that over 70% of model errors were caused by failures in spatial reasoning rather than an inability to understand the video itself.
The pattern continues on MMSI-Bench, where models must reason across multiple images instead of a single scene. Humans achieved 97% accuracy, the strongest reasoning models reached around 40%, and the best open-source models scored close to 30%.
Specific benchmark rankings change quickly as new models are released, so they should not be treated as permanent indicators of performance. For example, ReVSI recently rebuilt VSI-Bench after identifying questions that could not be answered from the visual information available to the models, showing that some earlier results were influenced by the benchmark itself. What has remained consistent, however, is the overall pattern: object recognition has improved significantly, while accurate metric and spatial reasoning continues to lag behind.
Common spatial failures
The table below outlines where failures often occur in systems attempting to understand and make accurate conclusions about physical spaces.
| Failure | How it shows up in production | Fix |
|---|---|---|
| No depth or scale in a flat image | Confident measurements that are implausible and wrong | Supply scale from depth sensors, stereo baselines, or survey control points |
| No persistent map between frames | Duplicated or missed counts across a walkthrough | Maintain the scene state outside the model |
| Captions never describe distance | Estimates fall back on typical object sizes | Measure against reconstructed geometry instead of asking the model |
| Viewpoint-dependent directions | Inconsistent left/right and front/behind answers | Fix an explicit reference frame and resolve directions against it |
| Invented geometry | Layouts that read well but do not match the site | Make the model call a spatial query rather than describe the scene |
Every fix in the table above points the same way. The model should not be the component responsible for making measurements.
The visual spatial intelligence pipeline
A production system replaces guessing with measurement in four stages:
- Capture the space.
- Reconstruct its geometry.
- Classify what is in it.
- Store the geometry in a form that can be queried, and let the model reason over query results instead of over pixels.
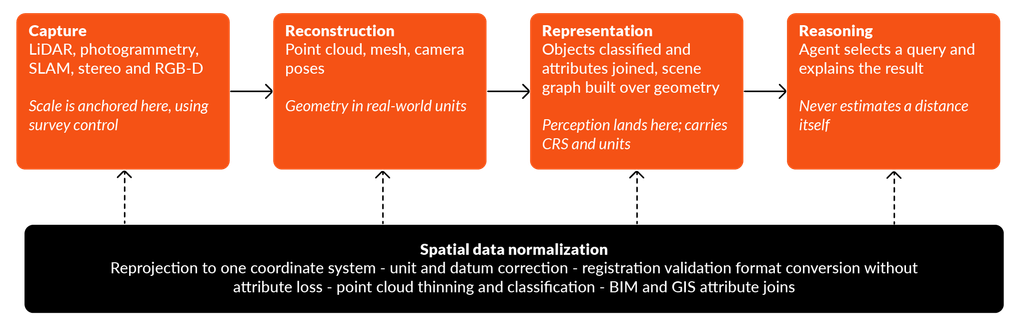
Capture and reconstruction
Each capture method produces a different geometry, and only some produce it in real-world units. Here are the capture methods compared on output, metric scale, and primary limitation.
| Method | Output | Real-world Units | Main Limitation |
|---|---|---|---|
| Terrestrial or mobile LiDAR | Dense point cloud | Yes | Hardware cost: reflective and transparent surfaces |
Photogrammetry / structure-from-motion | Point cloud and textured mesh | No, without control points | Fails on texture-poor surfaces such as blank walls |
| Stereo and RGB-D cameras | Depth map per frame | Yes | Short range; degrades in direct sunlight |
| SLAM | Camera trajectory and map | Only with inertial or depth input | Drift accumulates over long runs |
Feed-forward geometry models | Point map and poses from images | No | Fast but coarse; weak on fine detail |
Establishing scale matters more than choosing a sensor. Real-world scale has to be established at capture time, not added later. A 3D model reconstructed from ordinary photographs may have the correct shape and still have no idea of its actual size. Until its scale is established using a known measurement, a scale bar placed in the scene, or a known baseline between camera positions, every distance it reports is arbitrary. Adding scale afterward often requires reprocessing the entire dataset, making it far easier to establish it before the capture begins.
Choosing a representation
Once geometry exists, it has to be stored in a form that can be queried, and the options differ sharply. The table below shows spatial representations compared on strengths, costs, and how easily each can be queried.
| Representation | Best For | Storage Cost | Queryability |
|---|---|---|---|
| Point cloud | Raw measurement and clearance checks | High | Geometric only, no semantics |
| Mesh | Surfaces, visualization, line of sight | Medium | Good for geometry, weak for relationships |
| Occupancy or voxel grid | Free space and path planning | Medium to high | Fast boolean and reachability queries |
| Gaussian splat | Photorealistic novel views | High | Poor; not intended for measurement |
| Scene graph | Objects and their relationships | Very low | Excellent, but only as good as the classification |
In practice, the most effective approach is to combine two of them: geometry for measurements, and a scene graph for spatial relationships. The graph stays small enough to hold in context, and it carries the coordinate system and units explicitly so nothing downstream has to infer them.
{
  "crs": "EPSG:32617",
  "units": "meters",
  "objects": [
	{
  	"id": "T-04",
  	"class": "transformer",
  	"bbox": { "min": [412.6, 88.1, 0.0], "max": [416.2, 92.4, 3.8] },
  	"attributes": { "asset_tag": "TX-004", "voltage_kv": 115 },
  	"confidence": 0.94
	}
  ],
  "relations": [
	{ "from": "V-11", "to": "T-04", "type": "within", "distance_m": 2.4 }
  ]
}A scene graph fragment carrying coordinate system, units, geometry, attributes, and typed relations.
Wiring in the model
There are two ways to connect a language model to this data. The first injects depth maps or 3D features directly into the model and hopes the spatial reasoning will improve. The second exposes the geometry through external tools that the model can query, allowing it to request measurements and receive computed results.
The second approach is easier to debug because every answer has a query behind it that can be logged and re-run, and it is easier to change because the geometry engine can be swapped without touching the agent. Our guide to the geospatial MCP server covers how these spatial tools are exposed, orchestrated, and governed in production environments.
The following code shows the proximity question resolved against stored geometry rather than being estimated from images.
-- "Which assets sit within 3 m of transformer T-04?"
SELECT a.asset_tag,
   	ST_3DDistance(a.geom, t.geom) AS distance_m
FROM   assets a, assets t
WHERE  t.asset_tag = 'TX-004'
  AND  ST_3DDWithin(a.geom, t.geom, 3.0)
ORDER BY distance_m;This outlines the rule that governs the whole design. Any value carrying a real-world unit is calculated from geometry and never generated by the model.
Where the pipeline breaks: the spatial data layer
Once the architecture is in place, most failures shift upstream to the data layer. In production, spatial data issues cause far more incorrect results than model limitations, and they are often harder to detect because the system continues to produce confident-looking measurements.
Coordinate systems and measurement units are among the most common sources of error. A single project often contains data in multiple coordinate systems, such as local engineering coordinates, project grids, and geographic systems such as WGS 84. Even when the horizontal coordinates are correct, the vertical datum may be wrong, or heights may be stored in feet while horizontal coordinates use meters. These inconsistencies rarely cause anything to fail visibly, so incorrect measurements pass unnoticed. A reported clearance of 3 meters may actually be 3 feet, with the problem only becoming apparent when the vehicle arrives on site.
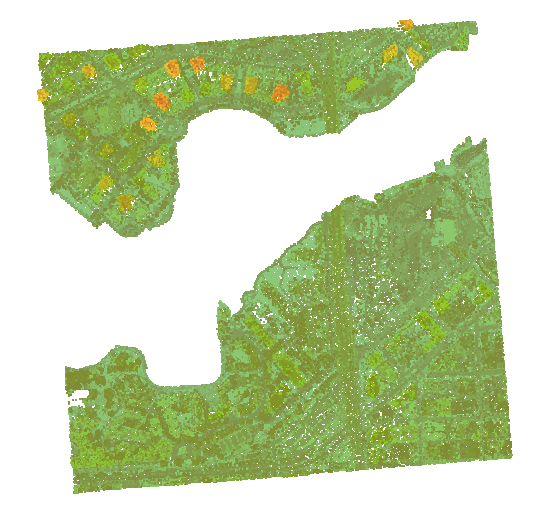
This issue is easy to reproduce. As an example, a LiDAR tile from a public open data portal was rejected outright by FME because the file carried no coordinate system definition. The metadata has to be supplied by hand before anything downstream can run.
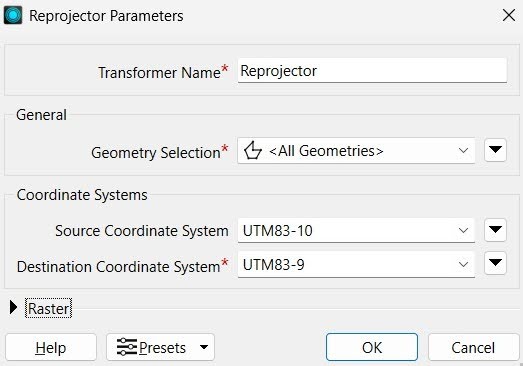
Registration errors are equally difficult to detect. Scans captured on different days may not line up, and SLAM trajectories drift over long runs, producing a reconstruction that is internally consistent while sitting in the wrong place globally. Validating against a small set of known control distances before the data reaches downstream systems catches this early.
File format fragmentation adds another challenge. Reality capture and design data are commonly stored in formats such as LAS/LAZ, E57, OBJ, glTF, IFC, CityGML, and 3D Tiles, each with its own way of storing metadata. Converting between these formats can discard important information, including classification codes, intensity values, per-point attributes, coordinate system definitions, and object relationships. The geometry is preserved, but much of the information needed for spatial reasoning is lost.
That metadata is what makes the reasoning layer useful. Raw geometry describes the shape and location of objects, but nothing about what they are. Joining BIM or GIS attributes adds the context that turns a surface into a load-bearing wall with a fire rating, or into transformer T-04 with a voltage rating and maintenance history. Without that information, the system can answer only geometric questions, not engineering or operational ones.
The final consideration is data density. A full-resolution scan quickly consumes storage, memory, and computation without necessarily improving the quality of the answer. Thin, tile, and serve the lightest representation that still supports the task at hand. For example, a clearance check does not require millimeter-level point spacing.
Here’s a summary of spatial data problems, how they surface downstream, and how to address each.
| Data Problem | Downstream Symptom | Fix |
|---|---|---|
| Mixed coordinate systems | Objects land hundreds of meters from their true position | Reproject everything to one declared CRS on ingest |
| Wrong vertical datum or units | Height and clearance values wrong by a constant factor | Record datum and units in metadata, never in filenames |
| Unregistered scans | Measurements correct within a scan but wrong across scans | Validate against known control distances before use |
| Lossy format conversion | Attributes and classifications disappear unnoticed | Verify attribute survival as a pipeline step, not by eye |
Geometry without attributes | Only geometric questions can be answered | Join BIM or GIS attributes onto classified geometry |
Excessive point density | Slow queries and exhausted context budget | Thin and tile to the lightest sufficient level of detail |
This is not modeling work but data preparation, and it is exactly what a spatial ETL platform like FME is built to do.
A real-world visual spatial intelligence workflow
Consider an electrical substation captured by drone photogrammetry and a handheld scanner. A field engineer needs to answer two questions:
- Which assets are within 3 meters of transformer T-04?
- Can a 2.5-meter-wide service vehicle safely reach them?
Answering these requires accurate measurements, asset attributes, a clearance check, and a reachable route at the same time, so it exercises every part of the pipeline rather than demonstrating one piece of it.
Responsibility is split across the five workflow steps.
| Step | What the agent does | What the spatial layer does |
|---|---|---|
| 1. Capture and reconstruct | Nothing | Photogrammetry and scan data merged into a scaled point cloud with survey control |
| 2. Normalize | Nothing | Reprojection to one CRS, unit and datum correction, registration validation |
| 3. Classify and join | Nothing | Point classification, then BIM and GIS asset attributes joined onto geometry |
| 4. Build representation | Nothing | Scene graph generated over the geometry, objects and relations indexed |
| 5. Query and answer | Selects the query, composes the reply | Executes the proximity and clearance queries, returns measured values |
The agent does almost nothing until step five, and even then it never estimates a distance. It selects a query, receives a measured value with a unit attached, and explains the result. That separation is what makes the answer defensible. When a field engineer disputes the 2.4 m clearance, the query can be re-run against the same geometry and the number reproduced exactly.
Implementing the data layer with FME
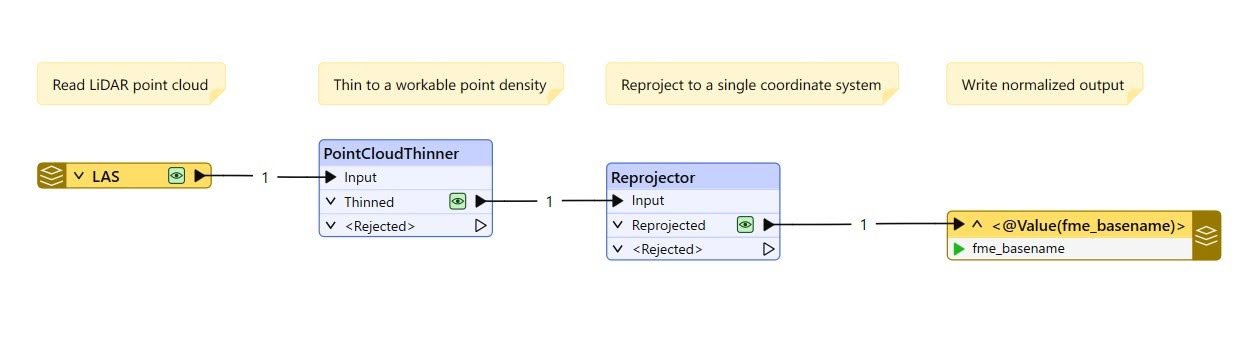
In practice, steps two and three are where many projects run into problems, and they involve data engineering rather than AI. This is where FME by Safe Software fits the workflow. It supports the tasks required to prepare spatial data for reliable reasoning, including format conversion, coordinate system transformation, point cloud thinning and classification, geometry validation, and joining scanned geometry with BIM or GIS attributes.
The substation workflow relies on both capabilities. FME’s point cloud and LiDAR support handles the reality capture workflow by filtering, thinning, classifying, and combining data from drone photogrammetry and handheld scans. Its 3D format support manages conversion between design and delivery formats while preserving the attributes and relationships that the scene graph depends on for spatial reasoning.
This is not a one-time process. On inspection and digital twin programs, new scans keep arriving, and the normalization has to run against each of them on the same terms as the last. FME Flow schedules that work so the representation stays current instead of drifting away from the site it describes.
With FME Flow’s MCP server capabilities, these workflows can be exposed as tools that AI agents call directly. Instead of working with raw scan data, the agent queries normalized, governed spatial data and receives reliable results.
Last thoughts
Visual spatial intelligence is not something a model can gain by simply adding more data or prompts. It requires a full pipeline: capturing the environment, creating a 3D representation, making that data searchable, and then allowing the model to reason over it. Systems that go directly from camera images to answers may sound convincing, but their responses have no measured connection to the real world.
The main problems are predictable and can be solved. A single image cannot provide true size or distance, so that information must come from another source. Models do not automatically remember a map of a space across multiple views, so that memory must be stored separately. And when a task requires a measurement, the value should be calculated from spatial data, not guessed by the model.
The quality of the spatial data is the foundation. Incorrect coordinate systems, mixed units, misaligned scans, and missing object information can cause failures before the AI model is even involved. Tools like FME help prepare this data by converting 3D and point cloud formats, aligning coordinate systems, checking geometry, and connecting BIM or GIS information to scanned data. With FME Flow exposing these workflows as MCP tools, agents can access reliable spatial data directly.
The key steps are simple: Fix coordinate systems and units first, create a searchable spatial model instead of sending raw images to a model, and keep measurements in the geometry system where they can be verified. The model should explain the results, not create the measurements.
Continue reading this series
Spatial Computing
Learn the basics of spatial computing and its benefits, key applications, and practical examples for processing spatial data using low-code frameworks like FME and traditional GIS software.
KML To GeoJSON
Learn about converting KML to GeoJSON files, including methods, best practices, and key differences between the two spatial file formats.
Geospatial Data Integration: Best Practices
Learn about the importance of seamless integration of diverse geospatial data sources and the challenges, best practices, and workflows involved in achieving accurate mapping and analyses for decision-making.
Shapefile To GeoJSON: Best Practices
Learn three proven methods to convert shapefiles to GeoJSON for modern web mapping applications.
Digital Twin Examples
Learn how digital twin examples are reshaping manufacturing, cities, hospitals, and farms with real-time data.
Augmented Reality Databases
Learn the key database types, data requirements, and best practices for building production-ready augmented reality systems.
MCP Server Geospatial: Tutorial & Implementation
Learn how a geospatial MCP server connects AI agents to spatial tools reliably and at scale.
Spatial Data
Learn how spatial data models, formats, and no-code automation tools simplify complex integration workflows.
What is Geospatial Data
Learn geospatial data fundamentals, real-world use cases, pipeline implementation steps, and best practices using FME.
Digital Twins in Manufacturing
Learn what digital twins are, their manufacturing use cases, and how to tackle data integration challenges while digital twins effectively.
Digital Twins in Urban Planning
Learn how digital twins in urban planning enable real-time monitoring, scenario simulation, and smarter infrastructure decisions.
GeoPandas
Learn how GeoPandas loads, validates, and joins vector data in a complete point-in-polygon workflow.
Geographic Data
Learn what geographic data is, how it works, and best practices for managing spatial data workflows.
Visual Spatial Intelligence
Learn how production systems combine spatial data and geometry to answer real-world measurement questions reliably today.