Digital Twins in Urban Planning
A digital twin is a continuously updated digital representation of a physical asset, system, or process. In urban planning, a digital twin typically combines spatial data, 3D models, sensor feeds, and operational data so planners can monitor current conditions, test scenarios, and evaluate how proposed changes may affect the built environment.
As urban systems become more connected and faster-changing, relying on static GIS layers alone is often insufficient for planning decisions that depend on current conditions and cross-system context. Digital twins instead support dynamic planning, simulation, and monitoring. The main challenge when implementing an urban digital twin is integrating data from GIS, BIM, IoT systems, LiDAR, imagery, and operational databases into a reliable pipeline that stays current over time.
This article explains the role of digital twins in urban planning, highlights spatial data integration challenges, and outlines implementation practices that make digital twins practical in production.
Summary of key concepts when using digital twins in urban planning
| Concept | Description |
|---|---|
| Digital twin | A digital twin is a continuously updated representation of a physical asset, system, or process that combines geometry, attributes, current state, and logic so a user can monitor or simulate real-world behavior. |
| Digital twins in urban planning | In urban planning, digital twins support land-use review, transportation analysis, utility coordination, resilience planning, and public-service operations by connecting city data to a shared spatial model. |
| Spatial data integration | A city-scale twin depends on integrating GIS, BIM, LiDAR, imagery, IoT, and enterprise data into one usable workflow instead of leaving them in disconnected silos. No-code data integration tools can simplify this work by helping teams connect, transform, and validate spatial data from multiple systems without relying entirely on custom code. |
| Interoperability | A usable twin must reconcile different schemas, coordinate systems, levels of detail, and object models across planning, design, and operational systems. |
| Temporal modeling | Digital twins are most useful when they can represent historical, current, and predicted states rather than only showing a static snapshot of a city. |
| AI/ML integration | ML models can enhance digital twins by supporting analysis, simulation, and prediction based on the data the twin collects and maintains. |
| Data quality and governance | Digital twins fail when geometry is invalid, timestamps drift, or data ownership is unclear, so validation, lineage, and governance must be built into the pipeline. |
| Best practices while integrating spatial data for digital twins | Effective digital twins are built to accommodate change, validate spatial data early, separate geometry from semantics, and deliver outputs at the right level of detail for planners, analysts, and field teams. |
Understanding digital twins
A digital twin is a continuously updated digital representation of a physical asset, system, or process. In urban planning, that usually means combining spatial data, operational data, and simulation logic so users can monitor current conditions and test future scenarios.
The physical counterpart of a digital twin can be a structure, process, or both. Anything from a warehouse to a manufacturing process to a city and its operations can be represented by a digital twin, as can many other things.
A digital twin is more than a static 3D model; it combines geometry, attributes, relationships, and analytical or simulation capabilities. A digital twin’s defining requirement is that it is synchronized with its real-world counterpart, actively ingesting and reflecting real-world data. A digital twin is not just a dashboard, GIS map, or one-time simulation but a dynamic representation of its physical counterpart.
Digital twins in urban planning
Digital twins are being used increasingly in urban planning and to represent “smart cities.” Often, a combination of consumer device data, city sensor data, and data collected by third parties is used to help inform the digital twin. Digital twin use in urban planning can provide several benefits, including taking advantage of data that already exists, reducing the costs and risks associated with inefficient systems within a city, and making better-informed decisions.
There are some downsides associated with using digital twins in urban planning, though, especially as it relates to the data collected and how it is collected to inform these models. One of the primary concerns is the degree to which people are being surveilled to collect the necessary data to inform the digital twin. When using urban digital twins, it is essential to understand any risks associated with public awareness as well as any personally identifiable data that may be collected.
Real-time awareness of urban systems
Digital twins provide real-time or near-real-time data about urban systems across transportation, utilities, public spaces, and environments. As conditions change, so does the digital twin. This allows operators and planners to see emerging patterns and test interventions before committing valuable resources.
Digital twins in transportation are often used to model real-life traffic patterns, understand bottlenecks, gridlocks, and congestion, and test changes in traffic signaling and geometry to address these issues.
In the utility space, water and electrical infrastructure are monitored to keep track of wastewater, runoff, water supplies, and water usage as well as electrical grid stress and disruptions. This allows operators and planners to see issues upstream as opposed to addressing only the symptoms of a problem. They can also play out “what-if” scenarios that allow them to test new infrastructure, simulate disasters, and prepare to address leaks and outages.
Digital twins are frequently used to assess disaster risk, especially in flood and earthquake-prone areas. They can allow planners to simulate disasters of various levels and learn how infrastructure will be affected, which areas are at the highest risk, and gauge the risk to human life. This allows them to build with this data in mind, increasing both resiliency and safety in cities.
The connecting thread across systems and departments is that digital twins allow planners and operators to see patterns and problems early, think proactively, and address issues before they become more costly and difficult to remedy.
Better decision-making through simulations
Urban digital twins allow planners to simulate changes before implementing them, gaining an understanding of the consequences of such decisions before time and money are allocated or mistakes are made.
Changes in infrastructure, service disruptions, and natural disasters can all have cascading consequences that affect multiple utilities, neighborhoods, and systems. Such wide-ranging effects can be difficult to assess or model without a digital twin. A digital twin allows not just assessment but accurate simulation of an urban environment, allowing for more informed decisions to be made.
Seamless collaboration across stakeholders by providing a shared understanding
Digital twins make it easier for different stakeholders to communicate and collaborate. Stakeholders for an urban planning project include not only planners but also engineers, utility teams, and emergency managers, among others. The digital twin can include data relevant to each stakeholder and allow them to understand how their layers, networks, and systems relate to a broader whole.
Applications in urban planning
The applications of urban digital twins are numerous. Areas of application include the following.
Energy management
IoT sensors and smart meters enable cities to build digital twins that mirror energy consumption patterns as well as energy generation infrastructure. They also help with implementing predictive maintenance and scenario-based simulations. Digital twins can help simulate how the energy demand shifts across seasons, time of the day, or even population growth, without the cost or risk of real-world trial and error. For example, the city of Copenhagen uses a digital twin to optimize supply temperature for its district heating system.
Traffic simulation
Digital twins can use live data from road sensors, GPS-enabled vehicles, and traffic cameras to recreate current road conditions virtually. Planners can use these simulations to test how new infrastructure—like an additional lane, roundabout, or traffic signal timing change—would affect congestion patterns before committing to costly construction. For example, the city of York in the UK used an urban digital twin built on about 100 live traffic sensors and signal controllers to test signal timing changes before they implemented them.
Disaster management
Digital twins help authorities model how natural or man-made disasters, such as floods, earthquakes, wildfires, or industrial accidents, will affect the city’s infrastructure. They can be used to identify vulnerable zones, stress-test evacuation routes, and evaluate the resilience of critical infrastructure like hospitals, power grids etc. For example, an urban digital twin was built for Calgary to model 2013 flood data to better understand which areas of the city were most at risk in the event of a flood and other disasters.
Waste management
Digital twins can be used to model the lifecycle of solid waste, from collection and transport to sorting, recycling, and disposal. They can integrate data from smart bins, collection vehicle routes, and waste processing facilities to help identify inefficiencies. They can also be used to simulate the effects of policy changes like new recycling programs. Switzerland has piloted a digital twin decision-support system using 98 smart bins equipped with fill-level sensors to achieve significant cost savings by optimizing pick up routes and timing.
Water management
City water systems are complex and span sourcing, treatment, distribution, and wastewater processing. Digital twins help with modeling the water network virtually and simulating the effects of wear and tear, leaks, or contamination events. They can also help test changes like pipe replacements or pressure adjustments before implementing them in the physical system.
For example, the city of Oporto in Portugal worked with Águas do Porto, a public company, to build H2Porto, a digital twin of the city’s water utility. H2Porto manages the urban water cycle using several water supply models, a sewer/storm and stream model, a coastal model, and a meteorological model. The twin is constantly updated and can trigger alerts when something goes wrong, so operators can respond quickly. H2Porto also supports running what-if scenarios to test improvements to water quality.
Challenges in building digital twins
Building a digital twin involves several complex processes, such as integrating data from several systems, transforming them, cleaning them, building simulation models, generating insights, and building an intuitive user interface. Some of the key challenges one can expect while building digital twins are as follows.
Spatial data integration
The biggest barrier to building urban digital models, and digital models in general, is combining heterogeneous sources that differ in format, scale, update frequency, and semantics. These data sources can include GIS, IoT, LiDAR, BIM, aerial imagery, ground camera imagery, and more. This data may have different modalities for connecting to the digital twin and differ in other ways that make handling all of it cumbersome and complex.
This is one area where a spatial framework with built-in support for multi-format integration and comprehensive transformation features can help. Tools like FME can be used to help manage this complexity and produce an effective urban digital twin. FME can act as the integration and automation layer of a digital twin, helping connect multiple systems, transform data, and support repeatable workflows without requiring every pipeline to be built from scratch in code.
Managing data volume and complex data types
Urban digital twins often require multiple data types of varying sizes, formats, coordinate systems, refresh rates, and input sources to run effectively. Managing high-volume data of different types and complexity in the same digital twin is a challenge that requires a high degree of engineering expertise as well as state-of-the-art infrastructure.
Interoperability across GIS, BIM, and 3D city models
Bridging GIS, BIM, and 3D city models can be a challenge because these systems describe the built environment differently and for different purposes, which makes interoperability a core digital twin challenge. They are different structurally, functionally, and stylistically; this includes differences in their geometry, semantics, scale, coordinate systems, encoding, and intended use.
For example, BIM captures component-level design semantics at the building scale and high precision, while GIS usually prioritizes geographic extent and locational accuracy across a city. BIM uses IFC, while many 3D city models utilize CityGML, two distinct languages for modeling and storing data.
Harmonization not only between the different kinds of models but also among geometries, semantics, scales, coordinate systems, etc. is the key to making coherent, accurate, and useful digital twins.
Temporal modeling
An effective digital twin should be designed for both historical and real-time data. Digital twins need to support a historical state for trend analysis, a current state for operational awareness, and a projected state for scenario testing. Cities evolve continuously, and the various data layers associated with them may update asynchronously. Thus, it is important to make sure that the various layers of a digital twin are timestamped, especially if different layers are updated at different cadences. Versioning is also key to tracking system states over time, performing temporal comparisons, and tracking changes.
AI/ML integration for simulations and predictions
Digital twins should be built for AI/ML integration, as ML models can enhance digital twins by supporting analysis, simulation, and prediction based on the data the twin collects and maintains. Integral to this development is the Model Context Protocol (MCP), a single open protocol that can allow any compliant AI client to connect with any compliant data source. This helps address the complexity and cumbersomeness of connecting one or many AIs to many data sources, often requiring many different integrations.
Data quality and governance
Spatial data validation should be prioritized. Treat validation as a core requirement to be done early and frequently, not a cleanup step. Geometry, coordinate, identifier, timestamp, and schema consistency are vital to creating an accurate and effective digital twin.
A framework that can perform automatic and repeatable checks to ensure data validity can ensure that poor-quality data is not propagated through a digital twin pipeline unnoticed and unchecked.
Building an urban digital twin
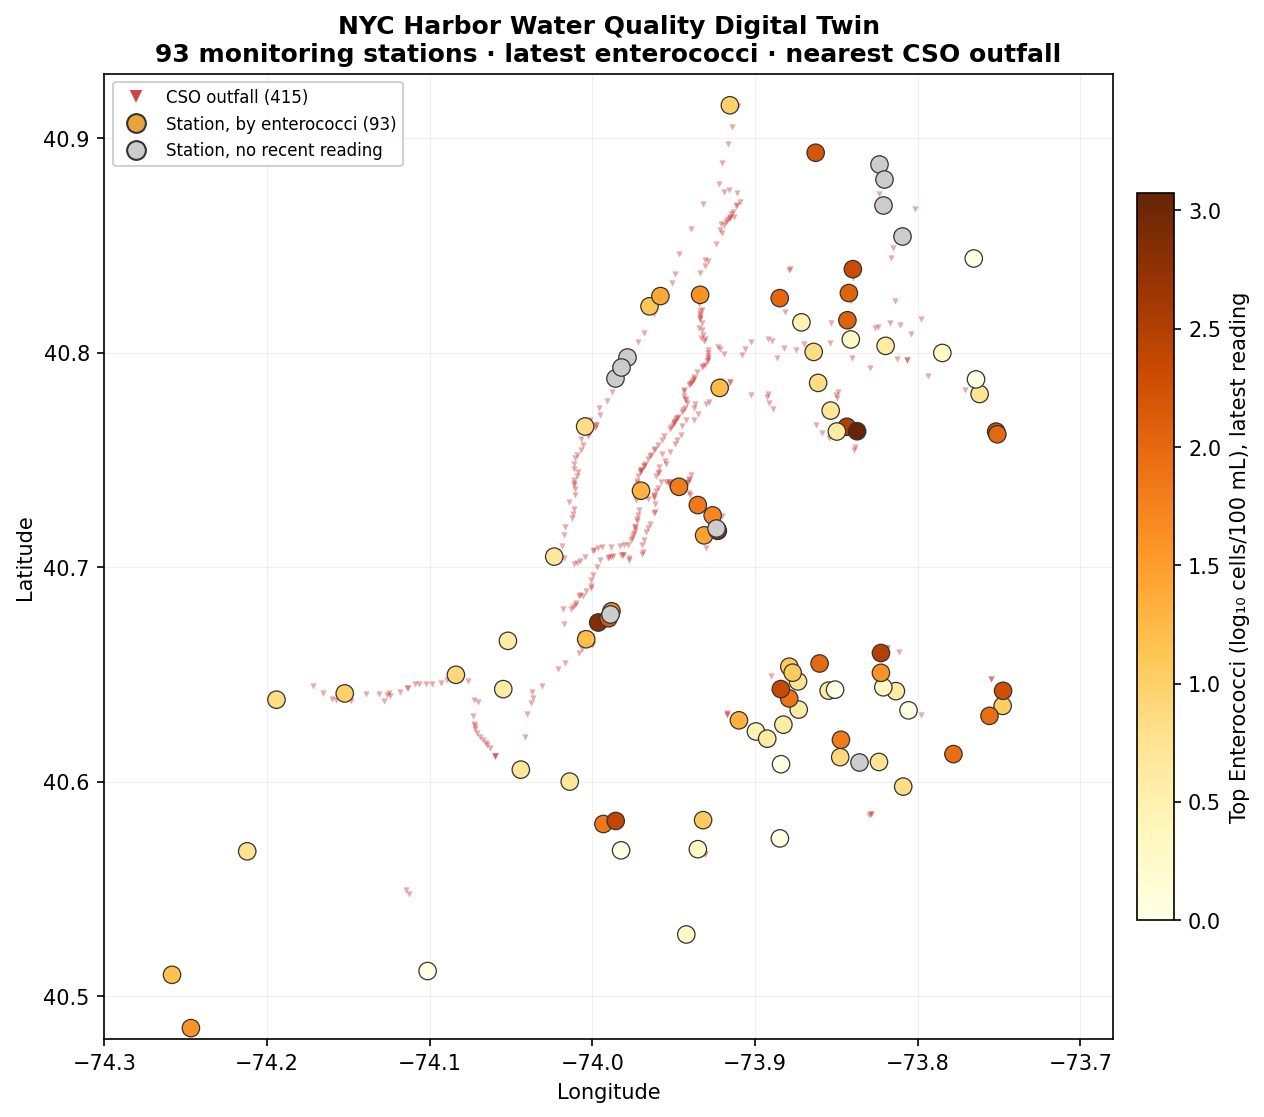
This tutorial builds a working urban digital twin of New York Harbor’s water quality entirely from open data. Each of the 93 harbor monitoring stations becomes a point that carries its most recent dissolved-oxygen and enterococci readings and knows its distance to the nearest combined sewer overflow (CSO) outfall. Every dataset comes from NYC Open Data, so it is reproducible with no proprietary sources.
Datasets used
The workflow uses only core transformers, so any edition of FME works, but some terms and features may change across editions. Lets consider four datasets from NYC Open Data:
- Harbor water quality (CSV): The reading history for every harbor station
- Citywide outfalls (CSV): Point locations of all outfalls that we’ll filter to CSOs
- NYC planimetric database—hydrography (GeoJSON): Water-body polygons for context
- Borough boundaries—water areas included (GeoJSON): Borough outlines for context
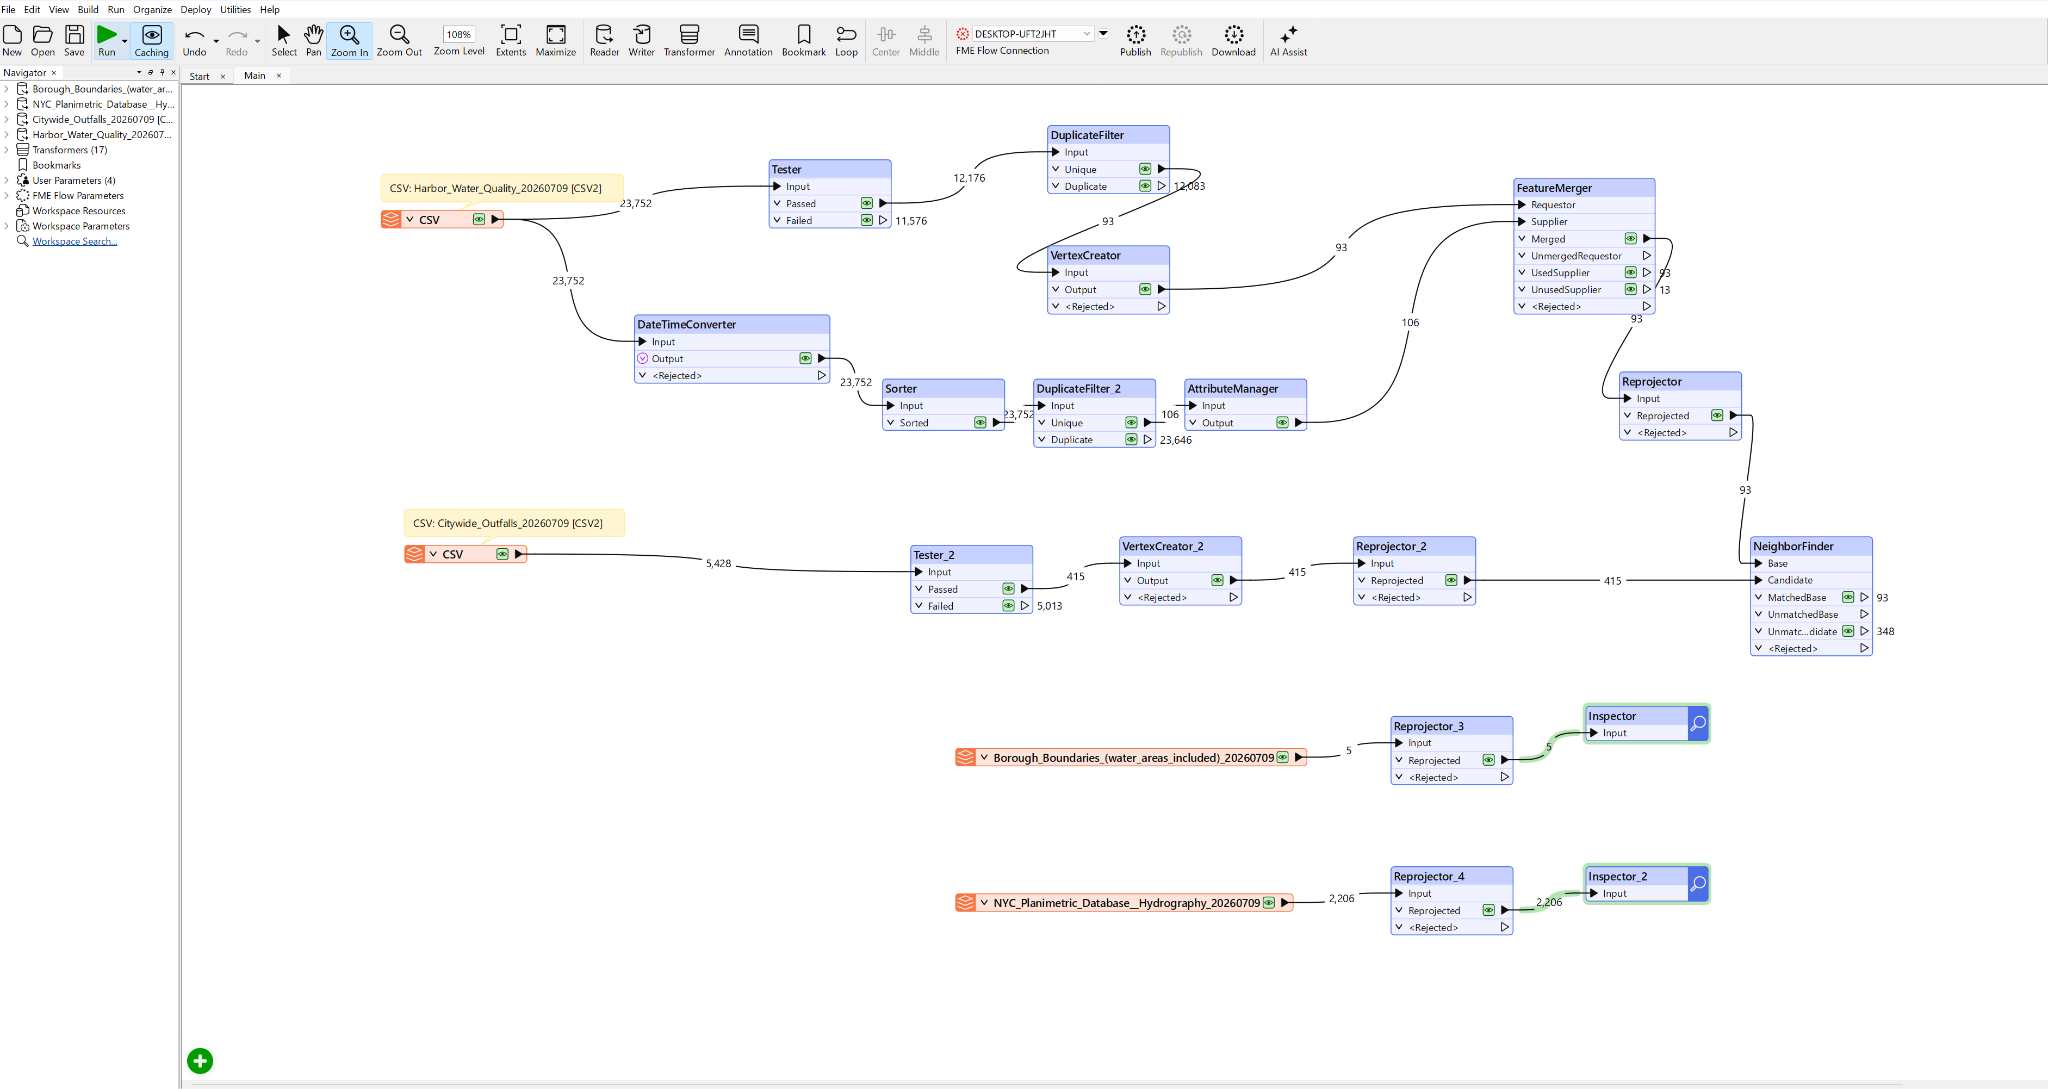
Two streams read the same harbor CSV. Stream A builds one clean point per station; stream B distills each station’s latest reading; a FeatureMerger joins them. A separate stream filters outfalls to CSOs, and a NeighborFinder stamps each station with its distance to the closest one. Everything is reprojected to feet.
Stream A: Build the station points
Goal: Turn the reading table into 93 clean point features, one per monitoring station, discarding rows with missing or corrupt coordinates.
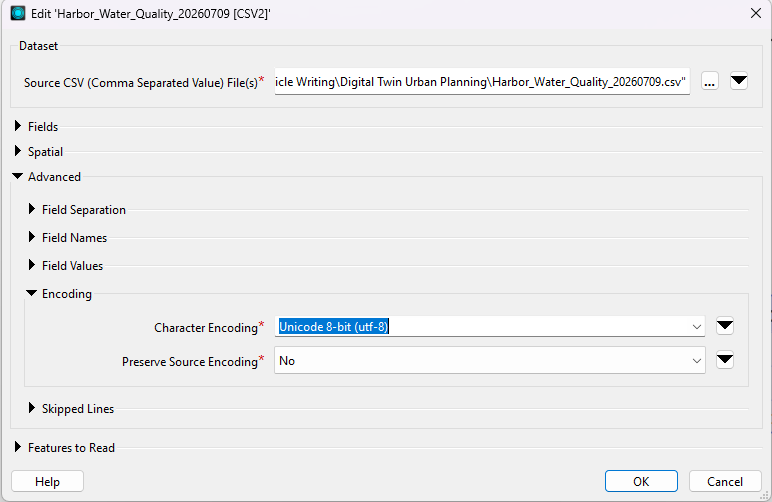
1. Add the Harbor Water Quality reader. Choose a CSV format.
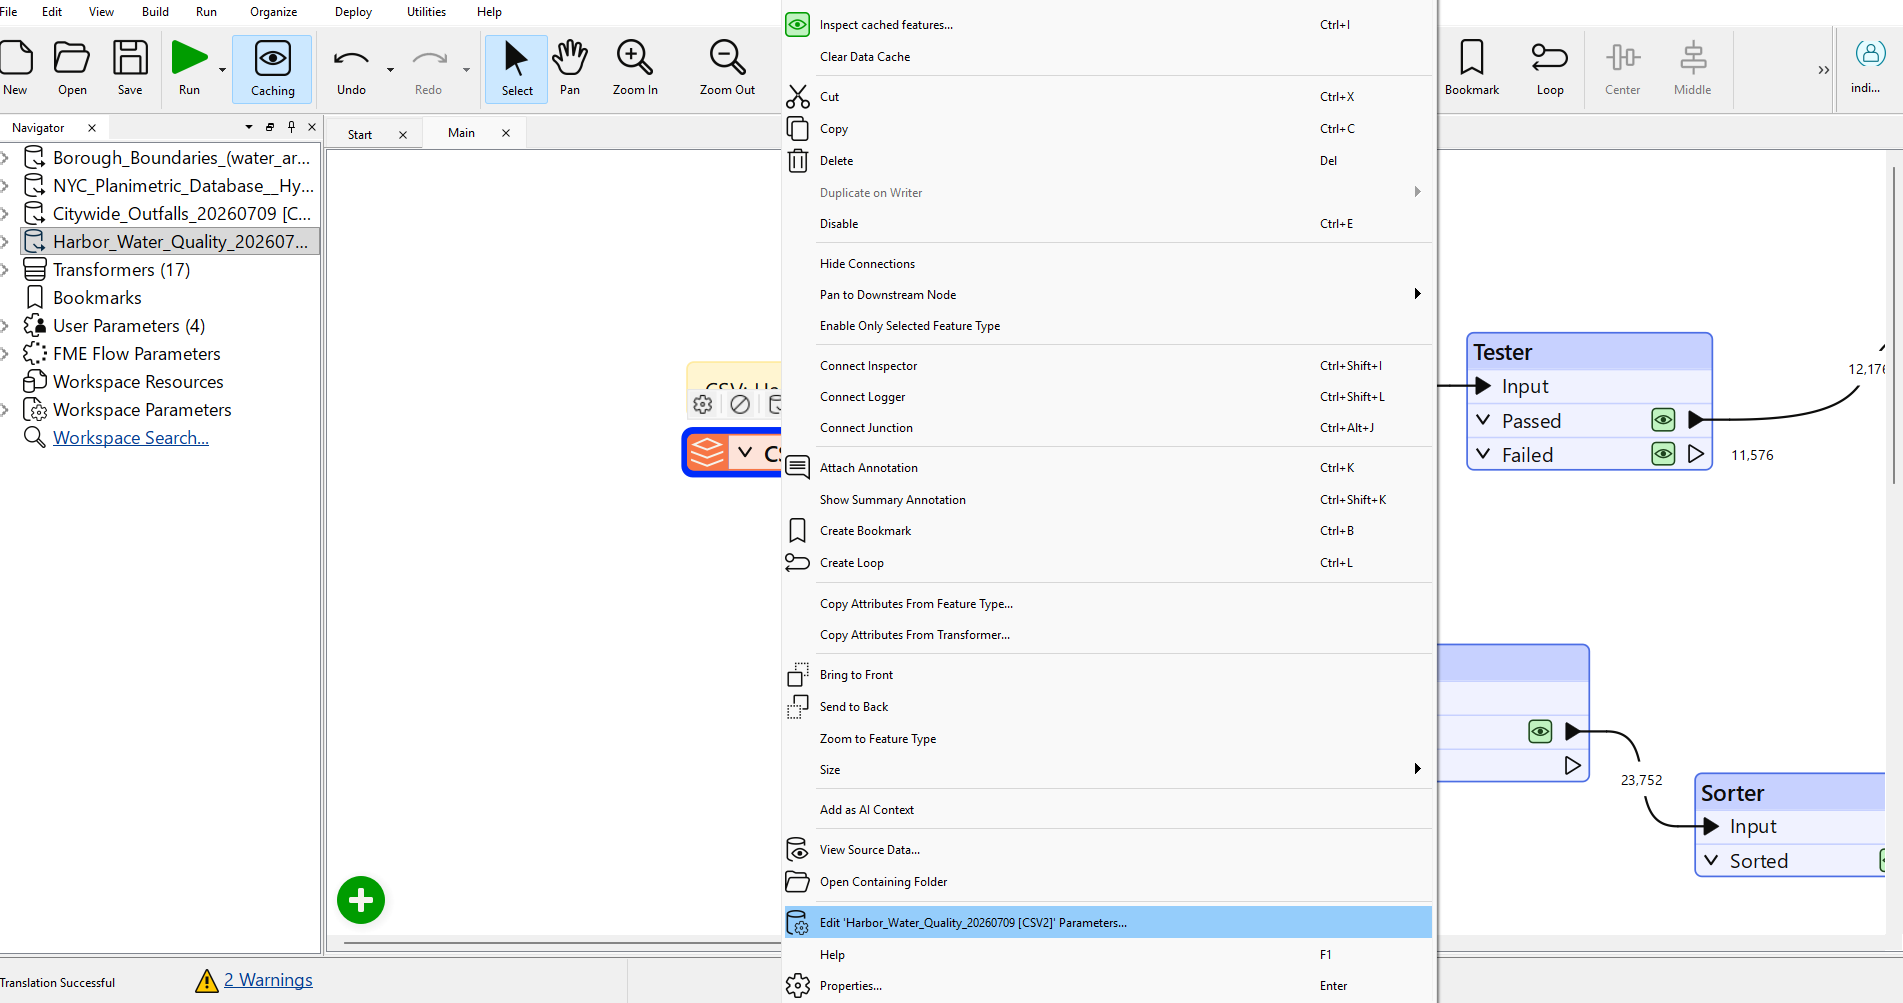
2. In the reader parameters, set character encoding to UTF-8. The source has degree symbols and micro signs in its headers; UTF-8 keeps them readable.
Filter to usable coordinates (Tester)
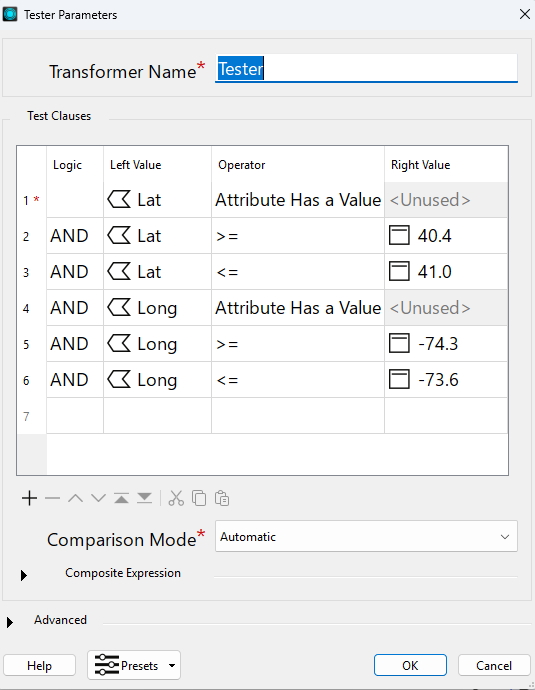
3. Add a Tester after the reader with six clauses, all joined by AND:
- Lat Attribute has a value
- Long Attribute has a value
- Lat >= 40.4
- Lat <= 41.0
- Long >= -74.3
- Long <= -73.6
Without this information, a station can get rendered in a completely different location, and the distance statistics are ruined.
Reduce to one point per station (DuplicateFilter)
4. Connect the Tester’s Passed output to a DuplicateFilter.
5. Set Key Attributes to Sampling Location. The Unique port now emits one row per station; leave the Duplicate port unconnected.
Expected result: 93 features on the Unique port.
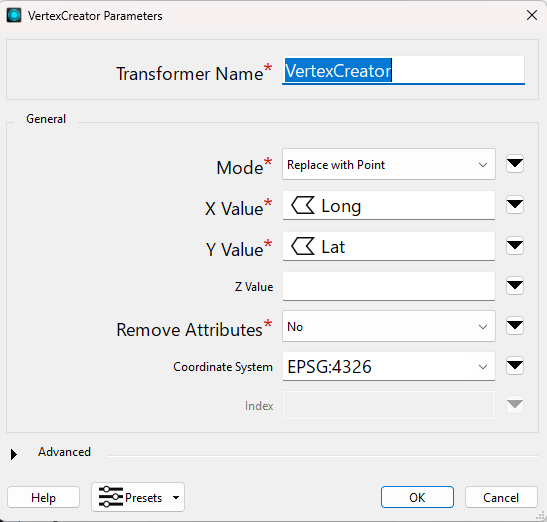
Create geometry (VertexCreator)
6. Add a VertexCreator after the Unique port.
7. Mode/Replace: Create Point/Replace with Point:
- X Value: Long
- Y Value: Lat
8. Set the output coordinate system to EPSG:4326 (LL84).
Stream B: Distill the latest reading
Goal: Keep only each station’s most recent dissolved-oxygen and enterococci values. Add a second Harbor CSV reader (or branch from the first CSV file) and build this stream in parallel.
Make a sortable date (DateTimeConverter)
9. Add a DateTimeConverter.
- Datetime Attribute: Sample Date. Input Format: %m/%d/%Y (the source uses MM/DD/YYYY).
- Output Format: %Y%m%d. Destination Attribute: date_key. This yields a sortable YYYYMMDD value without touching the original date.
10. Sort newest-first, then keep the top row per station
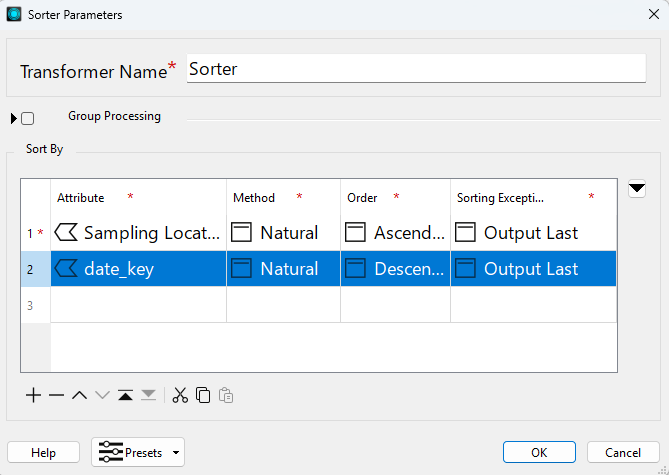
11 Add a Sorter. Sort by Sampling Location (Ascending), then date_key (Descending). The most recent reading for each station rises to the top of its group.
12. Add a second DuplicateFilter, keyed on Sampling Location. The Unique port now holds the latest reading per station.
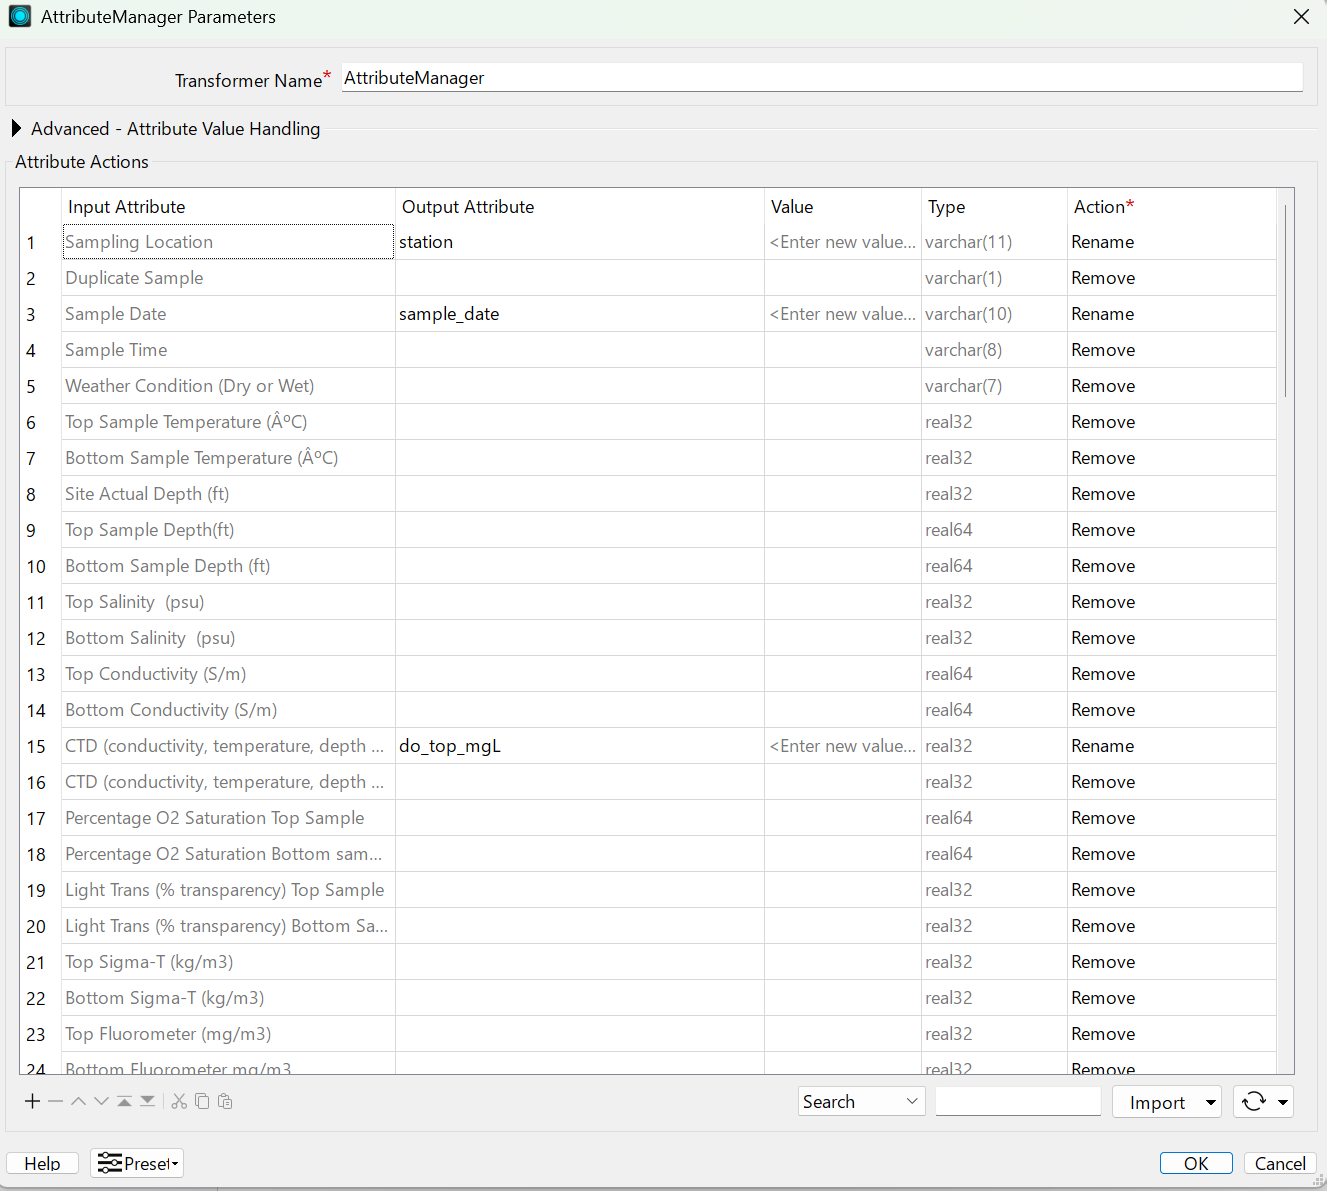
15. Trim and rename fields (AttributeManager). Add an AttributeManager. Keep and rename only the fields the twin needs; remove everything else:
| Source Field | Rename to |
|---|---|
| Sampling Location | station |
| Sample Date | sample_date |
| CTD (…) Top Dissolved Oxygen (mg/L) | do_top_mgL |
| Top Enterococci Bacteria (Cells/100mL) | enterococci_top |
Removing the ~90 unused columns keeps the merged output legible and the final file small.
Join the two streams (FeatureMerger)
Goal: Attach each station’s latest reading to its point geometry.
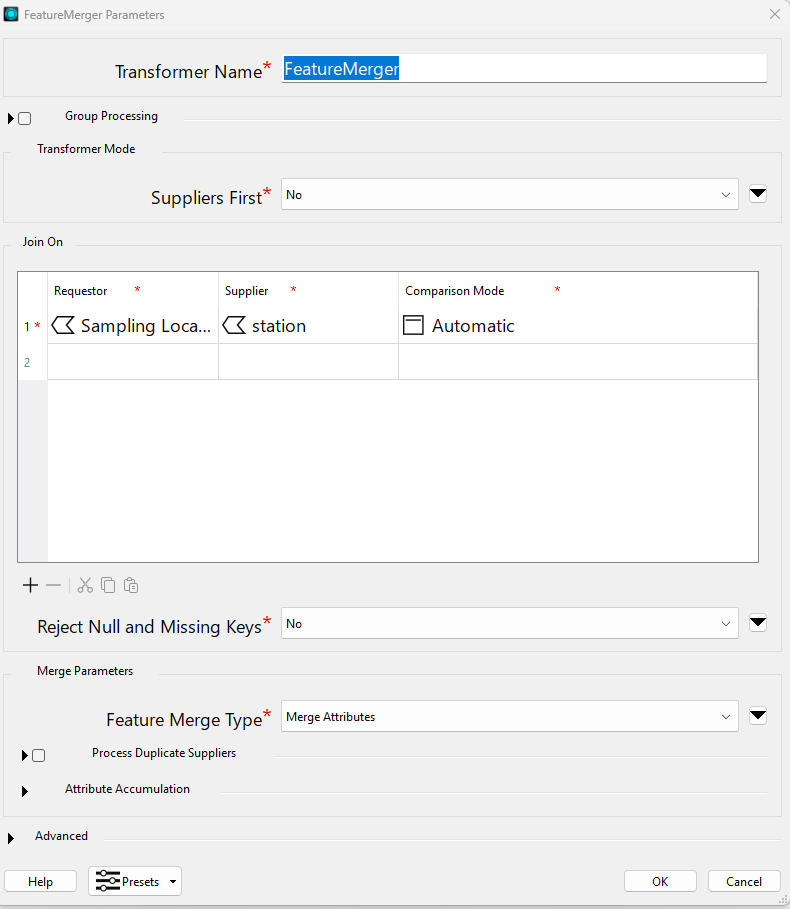
13. Add a FeatureMerger.
14. Requestor = Stream A (the station points from the VertexCreator).
15. Supplier = Stream B (the latest readings from the AttributeManager).
16. Join On: Requestor Sampling Location = Supplier station.
Note: Watch the join keys. Both sides must key on the station identifier. If the supplier key is accidentally set to a date field, nothing matches, and every requestor comes out unmatched.
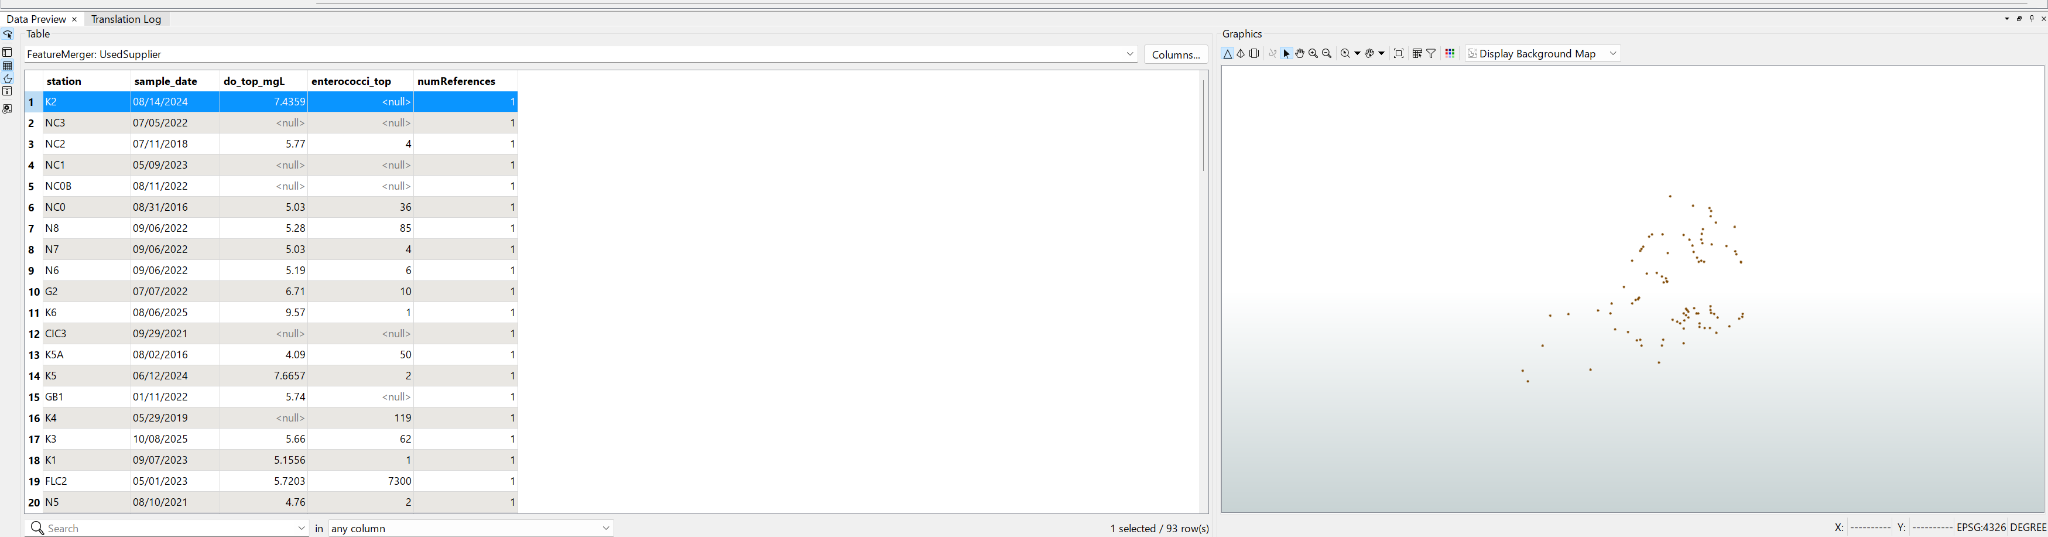
Expected result: 93 merged features, 0 unmatched requestors, and 13 suppliers go unused. Those are stations that have readings but never any coordinates, so they can’t be placed on the map.
Outfalls stream — Isolate the CSOs
17. Add the Citywide Outfalls CSV reader (UTF-8).
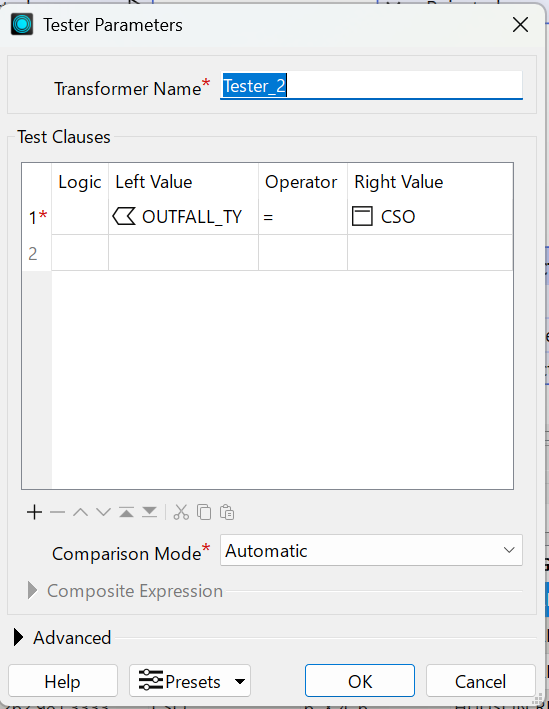
18. Add a Tester: OUTFALL_TY = CSO. Type CSO as a literal value; this is a value in the data, not a field to pick from a dropdown.
19. Add a VertexCreator: X = LONGITUDE, Y = LATITUDE, coordinate system EPSG:4326.
Expected result: 415 CSO outfalls from the 5,428 total. CSOs are the ones that discharge untreated sewage during heavy rain, which is why they, and not highway drains or culverts, explain the bacteria pattern.
Proximity analysis (NeighborFinder)
To measure distance in feet rather than degrees, both point layers must be in a projected coordinate system first.
20. Reproject to State Plane feet
Add a Reprojector to the merged stations and another to the CSO outfalls. Destination: EPSG:2263 (NAD83 / New York Long Island, US feet). Leave the source blank. The features already carry EPSG:4326, so FME reads it automatically.
Tip: Reproject the hydrography and borough layers to EPSG:2263 too, so every layer overlays cleanly in the viewer.
Find the nearest CSO
21. Add a NeighborFinder.
- Base = station points. Candidate = CSO outfalls. Number of Neighbors = 1.
- Under Attribute Accumulation, choose Prefix Candidate and set the prefix to cso_.
The Matched output carries a _distance attribute (feet to the nearest CSO, emitted automatically) plus cso_UNITID naming that outfall.
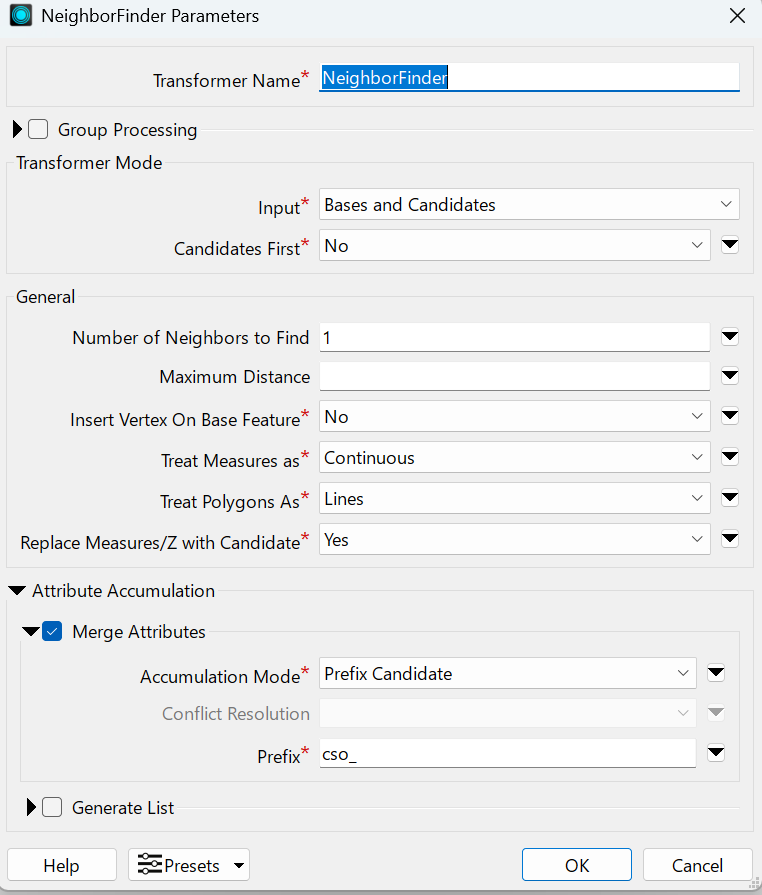
Expected values are as shown in the table below.
| Check | Expected Value |
|---|---|
| Matched stations | 93 |
| Unmatched base | 0 |
| Unused candidates | 348 |
| _distance range | 23 ft (min) → 43,548 ft (max), median ≈ 2,130 ft |
If your maximum distance reads in the millions of feet, a bad coordinate slipped through. Revisit the Stream A bounding-box Tester. A correct twin tops out at around 43,500 feet.
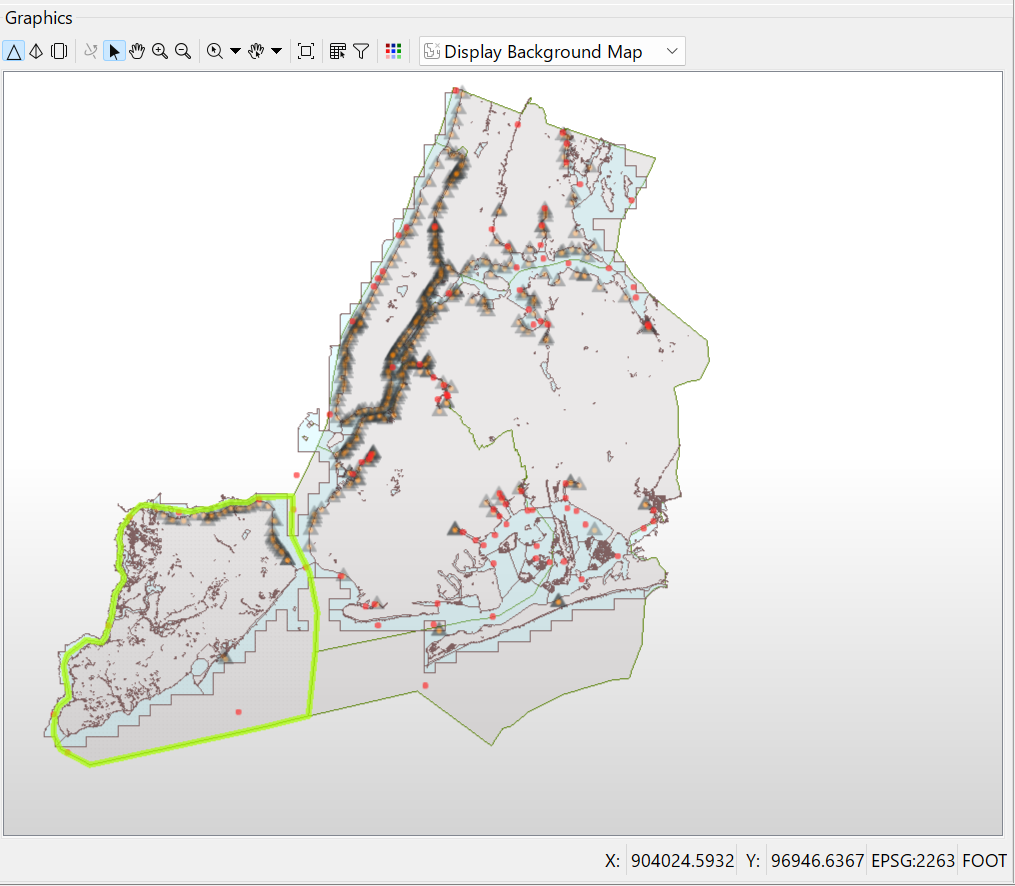
Add Inspector transformers to the ends of the streams you want to see: the NeighborFinder Matched output, the CSO outfalls, hydrography, and boroughs. Run the workspace; all connected Inspectors open together in the FME Data Inspector as toggleable layers.
For a publication figure, order the layers bottom-to-top: boroughs, hydrography, CSO outfalls, then stations on top. Color the stations by enterococci_top (a log scale reads best) so the bacteria hotspots stand out against the outfall pattern.
The completed workflow will look as below.
The outcome with overlaid map will look as below.
Best practices
Start with a narrowly scoped operational use case
Many digital twin efforts fail because they begin as broad “smart city” platforms instead of solving one concrete planning or operational problem. Starting with a focused use case—such as flood response, corridor planning, development review, or utility coordination—makes the twin more useful and sustainable.
A narrow use case gives measurable success criteria. For example:
- Did emergency response time improve?
- Were the number of overflow incidents reduced?
- Have the newly installed parks resulted in more foot traffic downtown?
A digital twin that solves one real problem garners more support to build it out as opposed to trying to deliver everything and not providing concrete, actionable answers. Narrowly scoped projects also help constrain the data that you would need to inform the urban digital twin and prevent overbuilding and data overload.
Establish authoritative data ownership and governance early
If teams don’t know which system is authoritative, who owns each dataset, how updates are approved, and how lineage is tracked, the twin quickly becomes untrustworthy. Governance should be documented and should name the system of record, the steward of the data, the update cadence, and the limitations for each data set. Governance decisions should be made as early as possible to avoid making decisions that are convenient at the moment but may not be good long-term.
Data lineage should also be tracked. If an analysis is disputed or challenged, being able to trace a result back to its source increases trust. Proper data governance improves trust not only in the data itself but in the urban digital twin that it informs.
Optimize data pipelines for change
Design workflows so new sources, schema changes, and updated requirements can be incorporated without rebuilding the entire pipeline. Modular pipelines (e.g., separate extract, transform, and load sections or templates) allow for source swapping without changing downstream logic. Templates can be made in advance that can be swapped into and out of various pipelines and modified as necessary. Add logging and error detection to pipelines to help flag issues early, as opposed to allowing errors to slip through the cracks and go unnoticed for extended periods of time.
Design for both historical and real-time data
Account for archived, current, and incoming data separately so the twin can support both trend analysis and operational awareness. Historical data can be useful for comparison analysis (then vs. now), while real-time data is useful for understanding what is happening at present and informing quick decisions.
Different data storage and update strategies might be developed for present-day, real-time data vs. historical data. For example, real-time data updating may focus on having low latency, while updates to historical data may focus on consistency, organization, and proper dating. Generally, present-day data and historical data together are more useful than either dataset alone.
Prioritize spatial data validation
Validate geometry, coordinates, identifiers, projections, and timestamps early so that downstream analysis and visualization remain trustworthy. Also, account for duplicates and null values, and coordinates that are inaccurate or impossible. Ensure that your timestamps and calculations make sense. Use the automated validation tools available to create validation rules that scale with your data.
Separate geometry from semantics
Keep the name of an object separate from its use case so the same spatial features can support multiple uses. For example, one building footprint can serve in a zoning analysis, emergency planning, or energy modeling digital twin, with each attaching different attributes to the same shape in a digital twin. Feature IDs on geometry should be stable with attribute tables joined by use case to help maintain use-case-agnostic geometries. This also allows geometries to improve independently, so when better or more detailed geometries are available, every dependent application benefits without changing naming conventions or running the risk of forgetting to update a geometry clone.
Design for multi-scale representation
Prepare data at different levels of detail, so outputs remain useful for citywide dashboards, corridor analysis, and field workflows. The same dataset will serve different stakeholders differently. Pre-computing varying degrees of detail is cheaper than forcing every application to render everything. Skipping this can lead to a common failure where the digital twin demos well on one screen but is unusably slow or has to be uselessly generalized everywhere else.
Last Thoughts
Digital twins in urban planning help optimize the multitude of operations required for a sustainable city. They help with energy management, water network optimization, disaster management, waste management, traffic simulation, and several other core functions.
Building a digital twin is not an easy process because of the multitude of formats involved, complex data transformations required, and the temporal modalities involved. A spatial data integration framework that natively supports most data formats and helps develop transformations with a simple drag and drop interface can be a great aid while building digital twins. FME is a low-code/no-code data integration platform with deep spatial capability. That can be of great value while building digital twins.
Continue reading this series
Spatial Computing
Learn the basics of spatial computing and its benefits, key applications, and practical examples for processing spatial data using low-code frameworks like FME and traditional GIS software.
KML To GeoJSON
Learn about converting KML to GeoJSON files, including methods, best practices, and key differences between the two spatial file formats.
Geospatial Data Integration: Best Practices
Learn about the importance of seamless integration of diverse geospatial data sources and the challenges, best practices, and workflows involved in achieving accurate mapping and analyses for decision-making.
Shapefile To GeoJSON: Best Practices
Learn three proven methods to convert shapefiles to GeoJSON for modern web mapping applications.
Digital Twin Examples
Learn how digital twin examples are reshaping manufacturing, cities, hospitals, and farms with real-time data.
Augmented Reality Databases
Learn the key database types, data requirements, and best practices for building production-ready augmented reality systems.
MCP Server Geospatial: Tutorial & Implementation
Learn how a geospatial MCP server connects AI agents to spatial tools reliably and at scale.
Spatial Data
Learn how spatial data models, formats, and no-code automation tools simplify complex integration workflows.
What is Geospatial Data
Learn geospatial data fundamentals, real-world use cases, pipeline implementation steps, and best practices using FME.
Digital Twins in Manufacturing
Learn what digital twins are, their manufacturing use cases, and how to tackle data integration challenges while digital twins effectively.
Digital Twins in Urban Planning
Learn how digital twins in urban planning enable real-time monitoring, scenario simulation, and smarter infrastructure decisions.
GeoPandas
Learn how GeoPandas loads, validates, and joins vector data in a complete point-in-polygon workflow.
Geographic Data
Learn what geographic data is, how it works, and best practices for managing spatial data workflows.
Visual Spatial Intelligence
Learn how production systems combine spatial data and geometry to answer real-world measurement questions reliably today.