
Key takeaways:
- Conflation aligns geospatial data from different sources so assets sit in their true real-world locations, and doing it by hand does not scale past a few thousand features.
- Building triangulated irregular networks (TINs) from the source and target datasets turns an unstructured point-matching problem into a tractable triangle-matching one.
- FME’s NeighborFinder transformer handles proximity matching during data prep, triangle matching, and vertex labeling.
- An operator can generate thousands of shift vectors per day this way, with automation handling most of the total effort.
Utility and energy organizations rarely start with data that sits exactly where it should. Assets get captured against old basemaps, digitized from paper, or inherited through acquisitions and migrations, leaving a network whose features are offset from their true positions. When you have a handful of assets to correct, you nudge them by hand. When you have several million, manual correction stops being an option. This is what conflation solves, and it automates well.
At the FME Special Interest Group: Utilities & Energy in April 2026, Isabel Skelton, Senior GIS Analyst at TRC, delivered a presentation that dives into this topic in detail. Join the group to access the replay and attend future virtual meetups!
What is conflation?
Conflation is the process of combining and harmonizing geospatial data from different sources to produce a single, more accurate representation of the same real-world objects. It involves matching features across datasets, merging and transferring their attributes, and reconciling the inconsistencies between them.
For positional correction, conflation means taking a set of assets that are offset by some unknown distance and moving them to geographically accurate locations, which line up with imagery, GPS survey data, or another trusted reference. You have two things: a set of source points (where the assets currently sit in your data) and a set of target points (where they actually belong). The job is to match each source to its correct target and move it there.
The key: match by triangles instead of by points
Given a cloud of source points and a cloud of accurate target points, how do you automatically and reliably decide which source corresponds to which target? In dense areas where several assets sit near each other, the closest target is not always the right one.
The technique that proves most effective is to stop matching individual points and start matching shapes. From each dataset, source and target, build a triangulated irregular network (TIN), which is a mesh of non-overlapping triangles whose vertices are your data points. TINs are typically generated using Delaunay triangulation, an approach that produces well-proportioned triangles and avoids long, thin slivers by ensuring no point falls inside the circumcircle of any triangle.
With a TIN over each dataset, you now have two meshes laid over the same area, and the matching problem becomes: which triangle in the source mesh corresponds to which triangle in the target mesh? Two properties drive that comparison:
- Centroid distance, i.e. how far apart the two triangles’ centers are.
- Percent area difference, i.e. how similar the two triangles are in size.
For each source triangle, the workflow should look for the nearest target triangle with the smallest difference in area. A third parameter, a maximum search distance, acts as a filter so the process never considers a candidate that is implausibly far away.
Note a TIN does not hand you its triangle vertices as discrete, addressable points. You have to generate them yourself and calculate coordinates for each one, so later steps can reason about individual corners rather than whole triangles.
Creating shift vectors
The goal is to create a shift vector for each asset, i.e. an arrow from where a source point currently sits to where it should be. To get there, match the individual corners of the matched triangles.
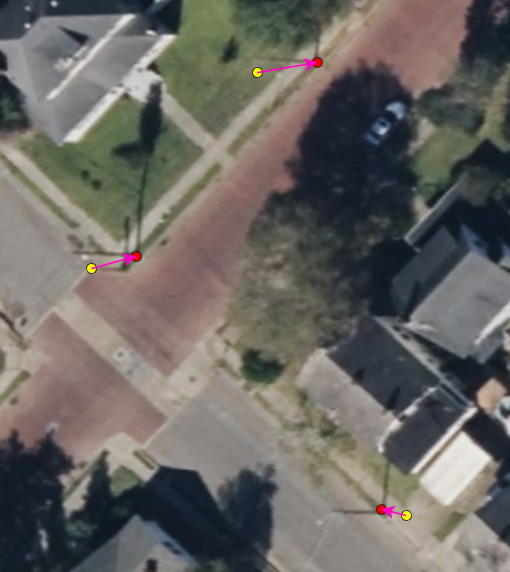
Image: TRC Solutions Inc.
That means labeling vertices consistently. Each triangle’s three corners are labeled (e.g. a, b, and c) using conditional rules and distance calculations, so corner ‘a’ of a source triangle ties to corner ‘a’ of its matched target. This is the most logic-heavy and variable part of the workflow, full of conditional branching to get the ordering right across every triangle in the mesh.
Once vertices are labeled and ordered, a sort followed by a line-building step connects each source vertex to its corresponding target vertex, and those connections are the shift vectors.
The whole FME workspace has 7 stages:
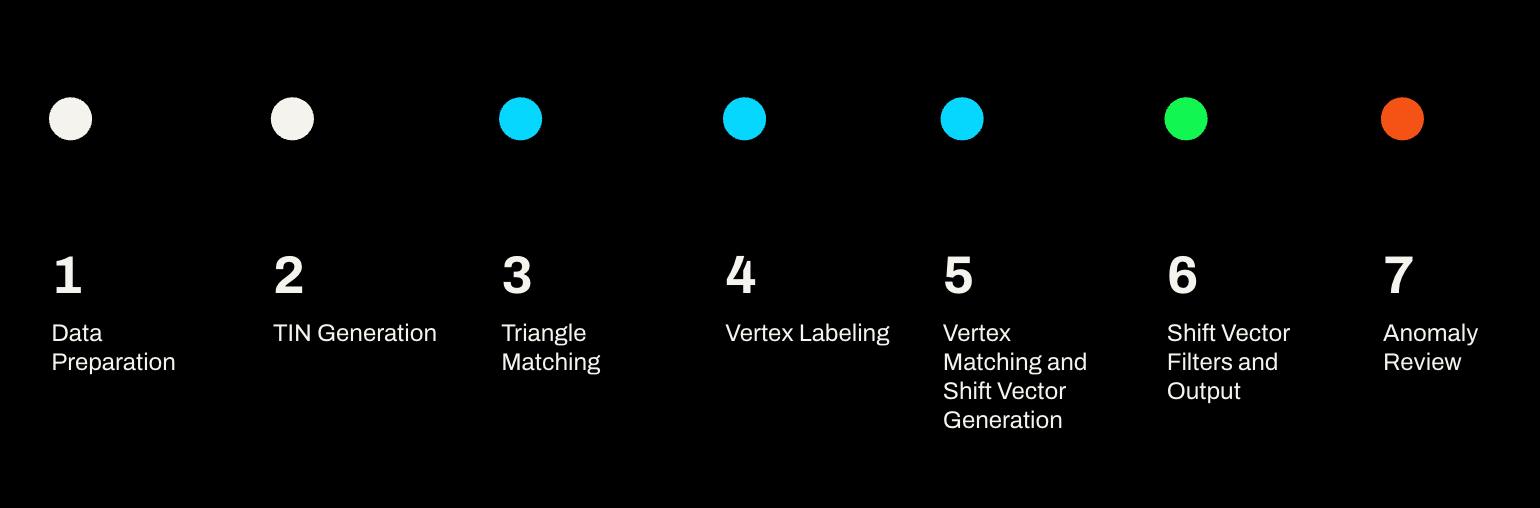
Every stage depends on clean inputs, so data preparation is a critical first step. This is where you filter out source points that sit in areas with no accurate reference coverage, remove target points that are clustered on top of one another, and discard severe outliers that sit far away from anything in the other dataset. Skipping this step can generate anomalies downstream.
Key FME transformer: NeighborFinder
FME’s NeighborFinder transformer takes a base set and a candidate set of features and, for each base feature, finds the nearest candidate or candidates, transferring their attributes and recording the distance and bearing to the match. It can return the single closest feature, a fixed number of nearest features, or everything within a specified distance.
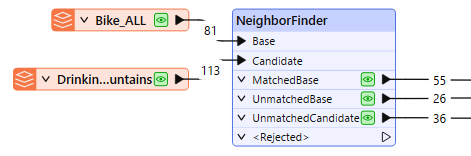
FME Workspace by TRC Solutions Inc.
That capability recurs throughout the workflow, filtering data during preparation, underpinning the triangle matching, and supporting the vertex-labeling logic. The closest feature is not always the correct match, but proximity is almost always where you have to start, which makes the NeighborFinder the backbone of the whole process.
Where manual review still comes in
The final stage of the workflow is where a human comes in for anomaly review. As shift vectors are generated, the workflow filters out the problem cases, source or target points that received no shift vector, or points with multiple vectors drawn to or from them, and routes them to separate outputs for a person to inspect.
This design tells the reviewer where to look. Rather than combing through every shift vector, the operator reviews only the flagged anomalies, guided by quality-control aids. The pattern matching is reliable enough that unflagged vectors can generally be trusted, which is what makes it scale: in a large production effort, a single operator produced on the order of 16,000 shift vectors per day (including prep time), and adding operators roughly multiplies that. Overall the approach automated an estimated 60 to 75 percent of the effort, with a typical anomaly rate of 20 to 25 percent. Against a backlog of millions of assets, that is the difference between a feasible project and an impossible one.
Conclusion
The recipe is reusable: prepare and filter both datasets, build TINs so you match structure rather than isolated points, match triangles by centroid distance and area similarity, then label and match their vertices to produce shift vectors. Filter the results and route only the anomalies to a human, leaning on proximity-based matching (NeighborFinder in FME) throughout, and remember that output quality is capped by how well your target data covers your source data.
Conflation isn’t fully hands-off, and it should not try to be. The realistic target is to automate the bulk of the routine matching, surface the genuinely ambiguous cases for review, and turn a job manual effort could never finish into one a small team can complete with confidence.
- Access the April 2026 Utilities SIG replay and slide deck
- Tutorial: Determining Nearest Neighbors – Learn how to use the NeighborFinder transformer to match each point in one dataset to its closest point in another, complete with distance and bearing.
- Tutorial: Find Nearest Features – See a real-world walkthrough of filtering point and polygon data first, then using NeighborFinder to answer a specific question like “which park is closest to this school?”