
Key takeaways:
- Real-time value depends on the pipeline behind it: the workflow that ingests, standardizes, validates, and routes streaming data before anyone acts on it.
- These workflows must reconcile incompatible formats and coordinate systems fast enough for the data to be useful.
- FME Flow handles real-time data through Streams for high-velocity feeds from brokers like Kafka and MQTT, and through Automations for event-driven triggers like webhooks and polling.
- Speed is worthless if the data is wrong, so automated validation is as much a part of real-time work as the streaming itself.
- Real-time data workflows are useful before, during, and after an emergency. The same pipelines that carry an organization through a crisis also keep residents informed day to day, which is where the long-term payoff lives.
When a river is rising, a fire is spreading, or a cyclone has just cut a rail line in half, the information bottleneck is rarely a lack of data. Sensors, cameras, phones, and field crews generate more than anyone can read. The bottleneck is getting that data into a usable shape, in the right coordinate system, validated, and in front of the person who has to decide before the moment to act has passed.
Moving data from many incompatible sources into something a dashboard or dispatcher can use in near real time is where a data integration platform like FME earns its place. The streaming feed is only as good as the pipeline standardizing and routing it.
FME Flow, the automation engine, ingests live data two ways. For high-velocity feeds, thousands or hundreds of thousands of messages per second from sensors and devices, Streams keep a workspace running continuously against a message broker such as Kafka, MQTT, or RabbitMQ. For event-driven data, Automations respond to webhooks, WebSocket messages, or frequent polling of an API or database. The logic itself, including reprojecting coordinates, filtering, validating, and converting formats, is built visually in FME Form and deployed to run automatically. Almost every story below is a variation on the same pattern: ingest a live feed, clean it, and push it somewhere it can drive a decision.
Rebuilding trust with real-time water monitoring: Hawke’s Bay
After severe flooding in New Zealand’s Hawke’s Bay region, restoring the community’s confidence included showing residents what the water was doing in real time. The response leaned on a network of sensors feeding live river-level and rainfall data, with radar gauges reporting at tight intervals that shorten further during warning events.
People who have lived through a disaster like this want to see the river level for itself, not read a press release, so this workflow was especially valuable for rebuilding trust. Turning scattered monitoring feeds into a continuously updated, public-facing picture is exactly the ingest-standardize-publish loop FME automates, and it is the difference between data that sits in a monitoring system and data a worried resident can check at midnight.
Read more: Rebuilding community trust through real-time water monitoring in Hawke’s Bay
Wildfire monitoring at network scale: FortisBC
As the largest natural gas utility and second-largest electric utility in British Columbia, FortisBC operates across a province where wildfire seasons have grown longer and more destructive, making fire monitoring a year-round discipline.
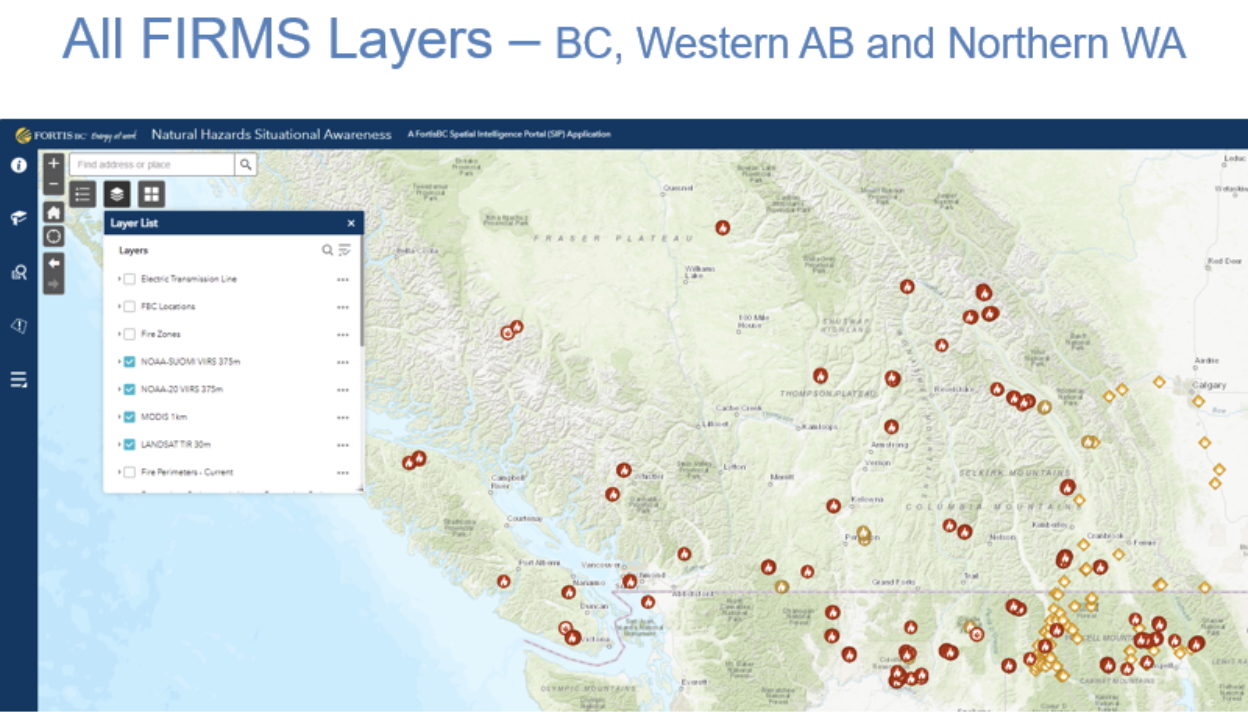
FortisBC uses FME to pull active wildfire data published by the BC Wildfire Service through the provincial DataBC portal and integrate it with its own asset and network records in a GE Smallworld GIS. The workflow runs automatically, checking for updated fire data on a regular cycle, and for any assets within a set radius of an active fire zone, it triggers notifications to the responsible regional managers. Threats to other critical infrastructure, such as schools and hospitals, are tracked the same way. The BC Wildfire Service publishes the data openly; FME’s value is turning that public feed into a targeted alert about this asset, near this fire, for this manager, without anyone manually cross-referencing maps during the worst days of a fire season.
Read more: FortisBC transforms wildfire monitoring with real-time data and scalable automation
Assessing cyclone damage in the field: KiwiRail
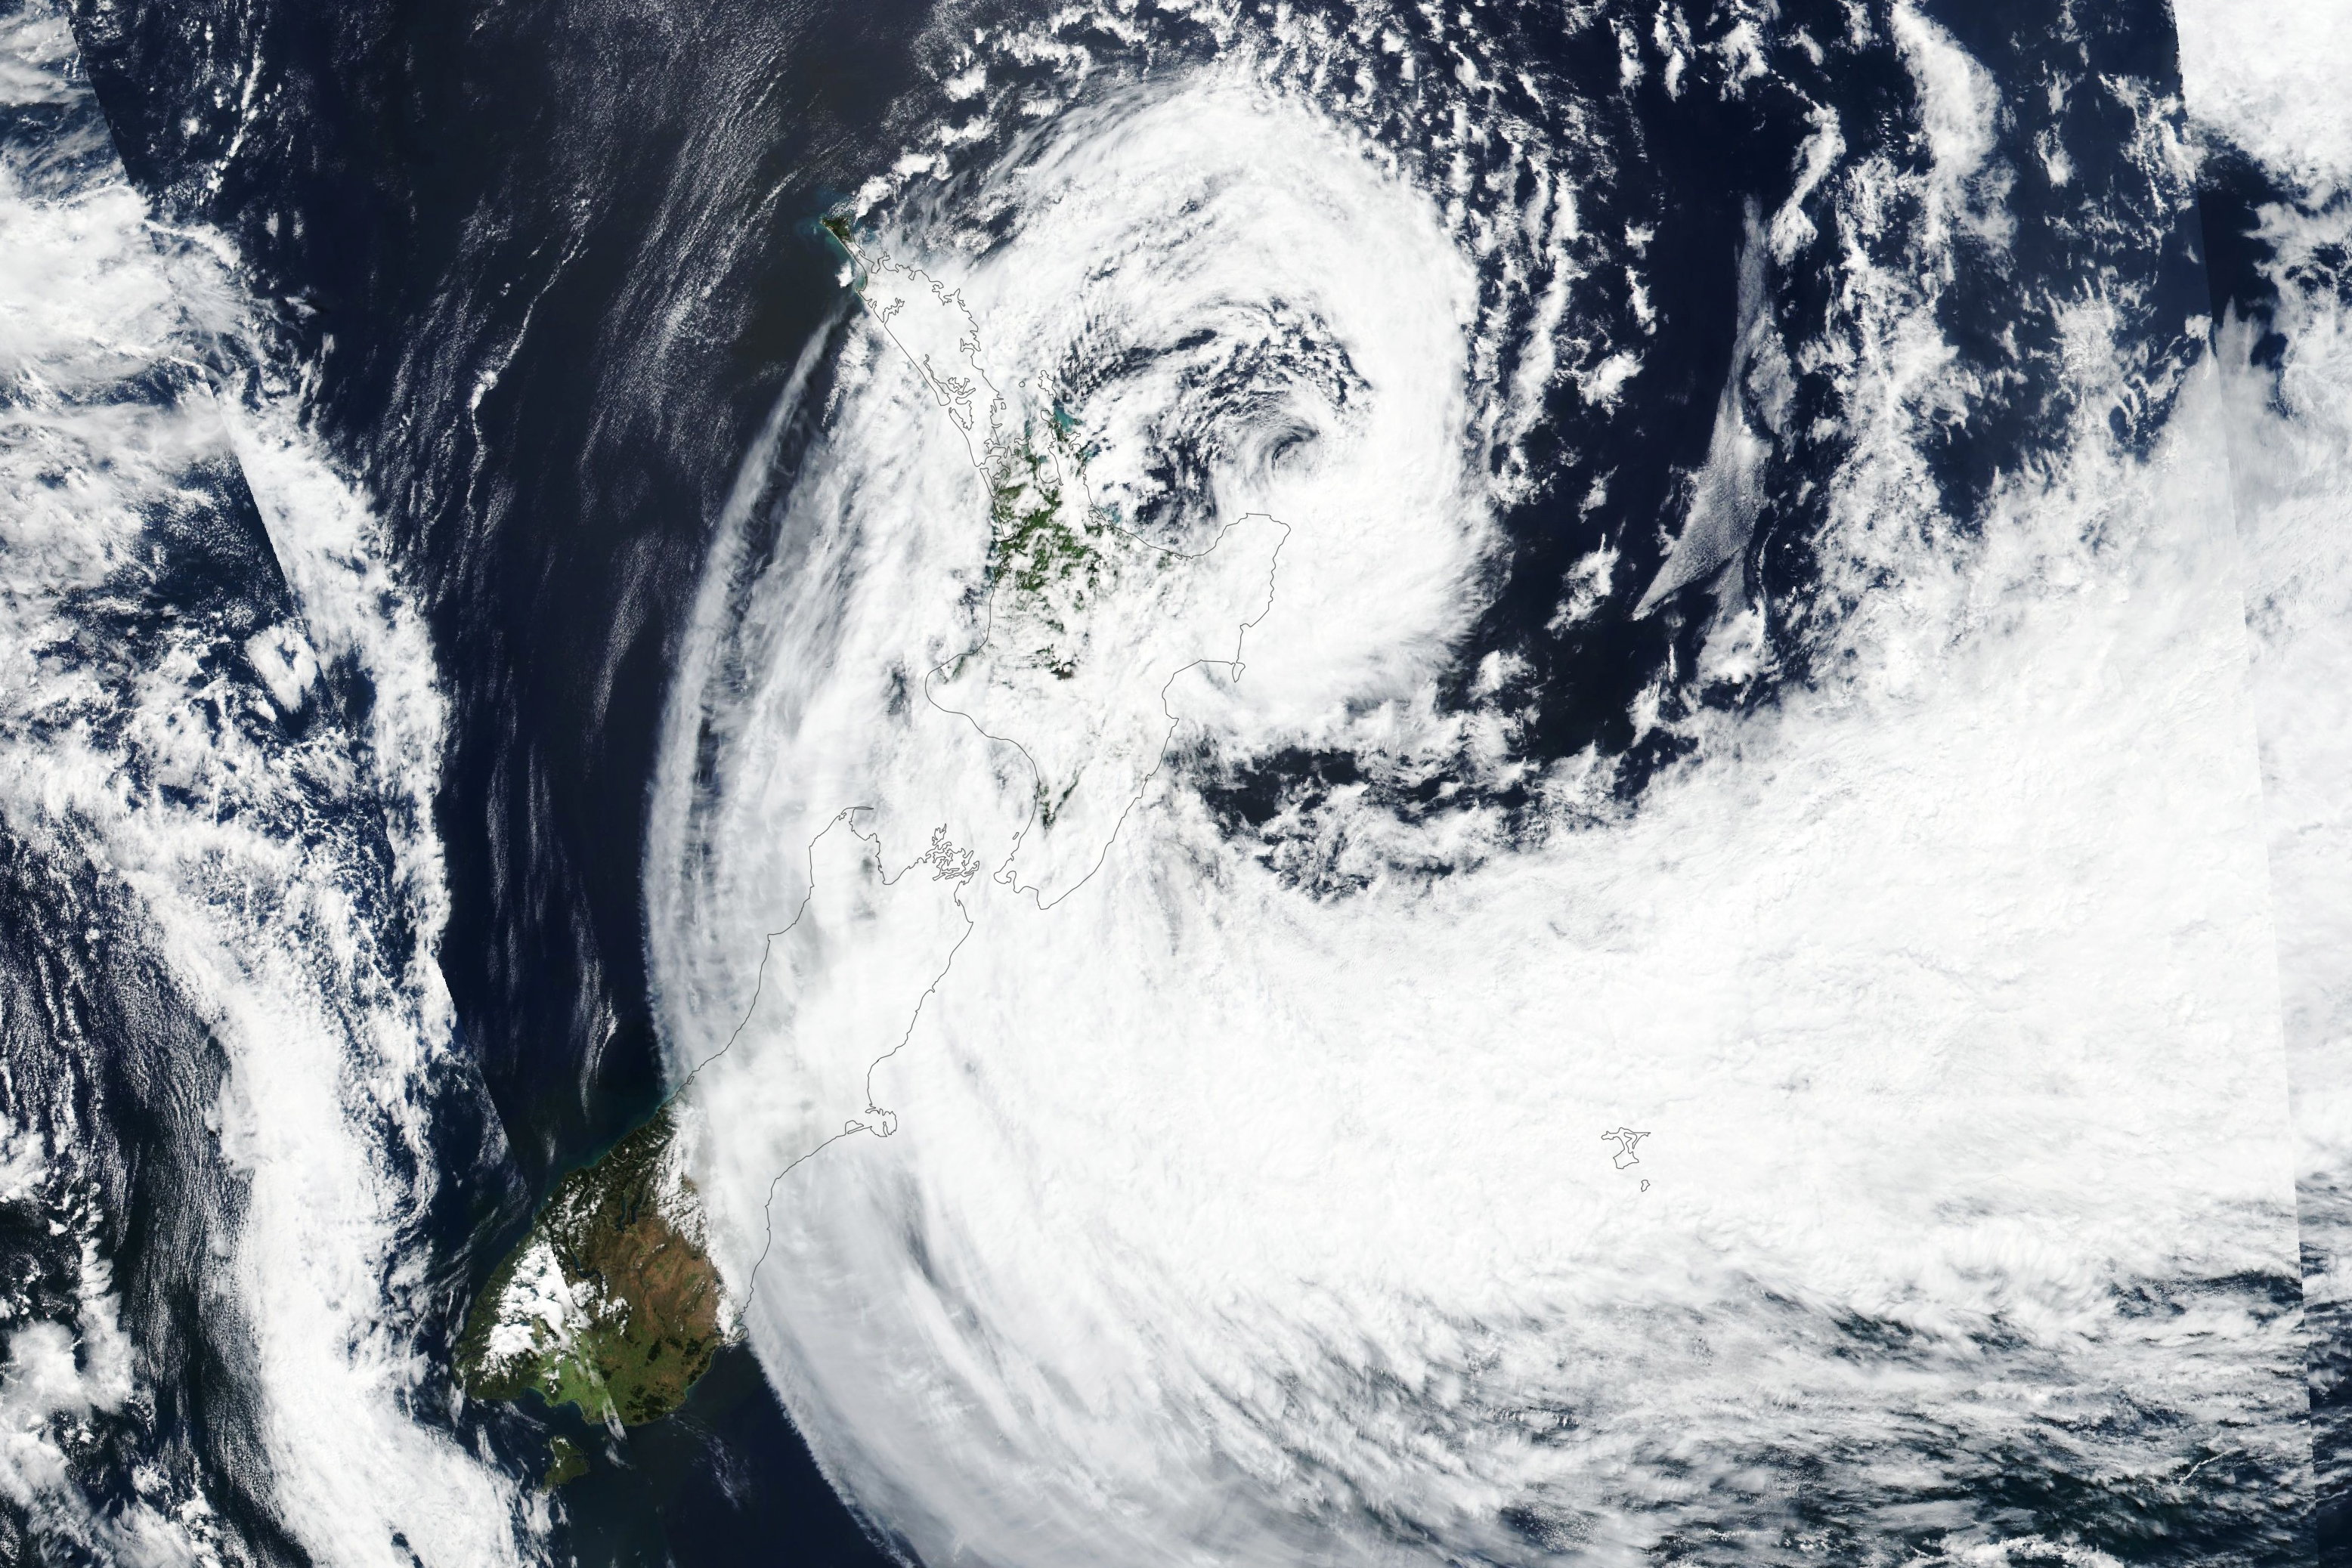
When Cyclone Gabrielle tore through the North Island in early 2023, it devastated railway infrastructure across Northland, Auckland, and Hawke’s Bay. With tracks cut and roads impassable, the hardest-hit areas could only be reached by helicopter, and frontline staff documented the damage the only practical way: hundreds of photos on their phones.
Working with Safe Software partner Locus, KiwiRail used FME to turn that flood of images into coordinated intelligence. FME collected mixed file types, including JPG and iPhone HEIC, and read the Exif metadata in each photo, location and timestamp, to place every image precisely on a map in Esri’s ArcGIS Online. Geospatial specialists could then process and upload photos in a few clicks, giving decision-makers a current visual picture of the damage across hundreds of kilometers of treacherous terrain. The workflow saved months of work. This is a great during-the-emergency example: not preparing for a hazard, but responding to one already underway.
Read more: How KiwiRail used FME for rapid Cyclone Gabrielle response
Knowing what is vulnerable before the storm: Powerco
As one of New Zealand’s largest energy network operators, with an electricity network spanning tens of thousands of kilometers plus a major gas business, Powerco needed to know which of its many thousands of assets were exposed to climate-driven hazards, across multiple climate scenarios and time horizons. Doing that manually would be impossibly slow.
With Locus, Powerco built a custom FME solution that automates a regional wide-area vulnerability assessment, overlaying geospatial hazard data against the electricity and gas networks to identify at-risk assets. A specialist team was trained to interpret the FME output in Powerco’s GIS, and the results feed directly into asset management strategy, expenditure planning, and the company’s Climate Adaptation and Resilience Plan and climate-related disclosures.
Read more: Powerco automates regional wide-area vulnerability assessment
A grant-winning safety platform: Caltrans
The California Department of Transportation manages one of the largest road networks in the world, more than 50,000 miles of highways and freeways, and has used FME as a core part of its data strategy for years. Its work spans a Digital Products Catalog that breaks down silos between divisions and efforts to simplify painful data conversions, such as moving engineering data between Civil 3D and DGN formats, from a cumbersome multi-step operation into a repeatable one.
Caltrans’s data-and-safety work has attracted significant grant investment, and its broader push toward real-time driver information, connected-vehicle technology, and data-driven safety analysis has been backed by federal grants precisely because faster, better data collection translates into fewer fatalities. FME’s role is upstream: reducing risk for field personnel who would otherwise gather measurements in hazardous roadside conditions, and making the pipeline reliable enough to build safety decisions on. A data platform that can point to grant dollars and a lives-saved mission in the same breath tends to travel well through a state agency.
Read more: Caltrans’ $5M grant-winning lifesaving platform to set new standard for US DOTs
Crowd safety as an emergency discipline: Roskilde Festival
A field with 120,000 attendees and 30,000 volunteers is its own kind of high-stakes operation. Denmark’s Roskilde Festival, one of the largest music events in the world, runs on far more than rhythm. Its GIS team, led for over a decade by volunteer and longtime FME user Christian Greisik, uses FME to manage everything from site planning to real-time maintenance and safety coordination.
Before FME, the festival’s mapping was rudimentary and largely manual. Now a web GIS backed by FME workflows underpins the operation, and real-time data management supports the safety effort for a crowd the size of a small city that appears and vanishes within days.
When it comes to sensors and data streams, the technology stack doesn’t care what the source is: the same workflow that watches a river can watch a festival ground.
Read more: Data meets the beat: how FME powers Roskilde Festival’s high-impact operations
When accuracy is the whole point: Alberta Health Services
Alberta Health Services serves more than four million people, and its emergency dispatch maps sit under every 911 call in the province. In real-time work, speed is worthless if the data is wrong.
The problem was not slow streaming, but slow correcting. Data inaccuracies during map updates could take a month of manual work to fix, thousands of errors at a time, in a system where minutes matter. AHS used FME to automate that validation against defined business rules, so errors are caught and corrected daily rather than monthly. The result is a faster, cleaner map-load process, dispatch maps that stay accurate and current, and quicker responses to emergency calls. When lives depend on the map, automated validation is critical.
Read more: Alberta Health Services maintains emergency response data accuracy with FME
From emergency response to everyday engagement: Gore District Council
Gore District Council, a small New Zealand authority serving a rural population of around 12,400, migrated its asset and property information into ArcGIS Online using FME, replacing a system where data could be weeks out of date with one that updates in near real time.
Where the council once relied on social media to announce road closures, it now publishes a live Closed Roads map driven by real-time data showing where roads are shut for repairs or flooding. The numbers make the case: during one flooding event the viewer was checked thousands of times over a few days, and during a heavier flood a year earlier it drew on the order of 15,000 views in three days, in a district of roughly 12,000 people. In this case, the same integration work that helps an organization respond to an emergency also keeps residents informed day to day, which is where the durable value lives.
Read more: Reimagining public data engagement through digital transformation at Gore District Council
Learn more
Across all these scenarios, the task is the same: reconcile incompatible formats, align coordinate systems, validate the data, and wire up live feeds fast enough that the result still matters when someone reads it. The organizations that get real value treat the streaming feed as the easy part and invest in the pipeline behind it, whether that runs as a continuous Stream against a sensor broker or an event-driven Automation firing on a webhook. Get that foundation right, and a dispatcher, a field crew, and a worried resident can all rely on the data.
- Working with Real-Time Data and FME: how Streams and Automations ingest live data, and when to use each
- Stream Processing: turn real-time data into insights: common streaming workflows and the IoT and messaging protocols FME supports
- Real-time Events and Streams: an overview of FME’s real-time data capabilities
- FME customer stories: the full library of case studies behind the projects above
- Data Integration for Public Safety: how emergency and risk-management teams use integration to act faster