Key takeaways:
- Web maps can be built using no-code tools (like ArcGIS Online, Carto, or Mapbox), or using custom APIs (like OpenLayers, Leaflet, CesiumJS, or Mapbox GL JS).
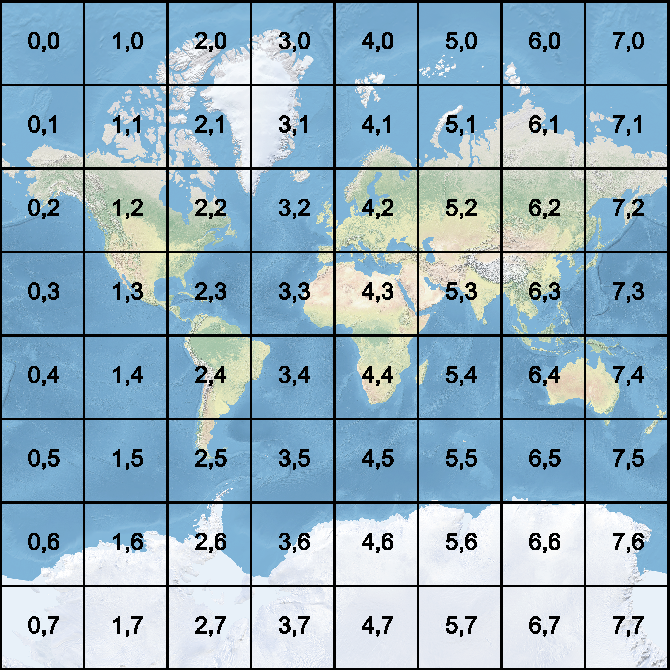
- Vector tiles improve map performance by breaking data into small pieces at multiple zoom levels, allowing the map to render only what’s visible.
- Use FME Workbench to prepare data for web mapping tools, including transforming the data, converting 2D to 3D, and generating vector tilesets.
- Use FME Flow to automate map updates and create live dashboards that connect to data streams and update the map continuously.
Web maps display geospatial data in a web browser in a dynamic and interactive way. They let you zoom, pan, filter, and even see real-time updates, transforming the way we visualize, analyze, and share geospatial information. Because they’re browser-based, they allow users to explore maps without downloading or installing anything.
So how do you build a web map?
In this post, we’ll walk through the steps for creating your own interactive map using FME and a variety of other tools. No matter your technical skill level, you’ll be able to make your data shareable on the web and empower users to gain actionable insights.
For a deep dive into this topic and to see live demos, watch our webinar, Web Mapping 101: Creating Dynamic Web Maps with Geospatial Data.
The technology behind web maps
There are two main ways to create web maps:
- No-code applications like ArcGIS Online, Carto, and Mapbox, which let you build interactive maps by uploading your data and choosing a style.
- Custom APIs like OpenLayers, Leaflet, CesiumJS, and Mapbox GL JS, which give developers full control over a custom solution through JavaScript, HTML, and CSS.
Example: Preparing data for ArcGIS Online and HTML Maps with FME
To transform and publish JSON data to ArcGIS Online automatically using FME:
- Read the data using a GeoJSON Reader to pull in data from a web URL or local file.
- Clean and transform the data using transformers, e.g. use the AttributeManager to rename fields, convert timestamps with DateTimeConverter, and categorize data (for example, sorting earthquake magnitudes).
- Use an ArcGIS Online Writer to upload data as a hosted feature layer.
- Once uploaded, you can visualize magnitudes, locations, and timestamps directly in ArcGIS Online, or embed your map in an HTML page.
To make data presentation even easier, FME’s HTMLReportGenerator can automatically create a web page that includes both a map and analytical charts (like histograms or bar charts).
Raster tiles or vector tiles?
When a web map is opened, the browser requests geographic data from the server in the form of tiles or features. The map library then renders those features in an interactive way.
There are two main tile formats for web mapping:
Raster tiles (pre-rendered images) are a simple and traditional data format for web mapping because they display quickly, but they can’t be styled dynamically.
Vector tiles are the modern standard for performance and flexibility. These are compact datasets that render on the fly and allow you to change styling, toggle layers, and interact with individual features.
OpenLayers vs. Leaflet?
OpenLayers and Leaflet are both excellent open-source JavaScript libraries for building web maps. Both integrate seamlessly with FME to bring your geospatial data into the browser.
For quick prototypes and small projects: Leaflet is simple, lightweight, and beginner-friendly. It’s easy to bridge Esri services with open-source maps using Esri Leaflet, a plugin that lets you bring your ArcGIS layers into a live web app.
For enterprise-scale mapping: OpenLayers supports multiple projections, advanced symbology, and high-performance rendering, making it ideal for power users and complex applications.
How to create Vector Tilesets with FME for fast, scalable web maps
A vector tileset breaks data into small pieces (tiles) at multiple zoom levels. This allows the map to render only what’s visible, ensuring high performance.
To generate vector tiles, use FME to build a no-code workflow to:
- Read your source data, e.g. shapefiles, databases, etc.
- Transform the data, e.g. clean, reproject, simplify, or filter using transformers.
- Write out the vector tiles using the Mapbox Vector Tile Writer. Each feature type becomes a layer with its own zoom level. When the workspace is run, thousands of tiles are created in seconds, typically stored in folders representing zoom levels and coordinates.
- Upload the tileset to a web server using a cloud connector like S3, Azure, or Dropbox. Once uploaded, these tiles can be displayed in a browser using your web map tool of choice or FME’s HTMLReportGenerator for a simple webpage.
This process will produce a lightweight, high-performance web map that’s easy to share and explore.
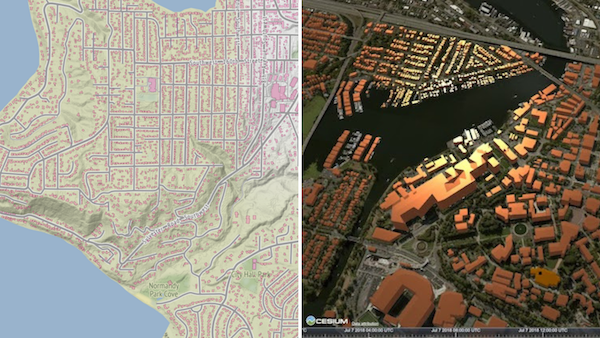
How to create 3D web maps
3D web mapping adds depth to your spatial analysis, helping you visualize everything from cityscapes to terrain models. This turns data into an immersive experience that might offer more insights to users, depending on your industry. For example, it might be more useful to view a 3D building or cityscape than a flat 2D map.
To transform a 2D dataset (e.g. building footprints) into a 3D web map in FME:
- Read the 2D source data, e.g., GeoJSON building polygons with elevation attributes.
- Transform the data to prepare it for writing:
- Reproject to UTM for accurate vertical scaling.
- Extrude features using the Extruder transformer to create 3D geometry.
- Add textures with the AppearanceSetter transformer.
- Simplify the data to prevent browser slowdowns.
- Add quality checks to check for geometry errors.
- Write the output as web-ready 3D tiles. FME supports Cesium 3D Tiles, i3S, glTF, three.js, and more.
- Preview and publish. Upload to Cesium Ion or any 3D viewer to share your creation via URL or embed it in a web page.
Automating web map updates using the FME Flow REST API
To make your web maps more dynamic and interactive, the FME Flow REST API lets the web app communicate with FME Flow to process or serve data on demand.
It can trigger FME workspaces whenever users upload new data, incorporate fresh data directly into the map, and generate layers dynamically.
For example, you could create a map that updates every time someone uploads a new dataset. The web app sends the file to FME Flow, FME processes it, and the results appear instantly on the map.
Live maps: Creating real-time dashboards using data streams and WebSockets
You can also set up real-time mapping, where data streams continuously to your web map.
WebSockets are a two-way communication protocol that keeps a constant connection open between server and client. They’re ideal for live tracking (vehicles, aircraft, sensors, etc.) or monitoring rapidly changing data.
Using WebSockets with FME Flow, you can push live updates directly from your server to users’ browsers.
Examples of real-time maps include tracking assets, displaying live weather or environmental sensors, and monitoring infrastructure or IoT devices.
FME Flow’s WebSocket capabilities make it possible to design a workflow that listens for new data, processes it, and immediately updates the web map, turning your visualization into a live dashboard.
Step-by-step web maps
Creating your own web map might look like this:
- Use FME Workbench to create a repeatable workflow that prepares and converts data into vector tiles.
- Publish the workspace to FME Flow to automate and serve the data.
- Use a web mapping tool to display the data interactively.
- Integrate the FME Flow REST API to fetch or process data on demand.
- Add WebSockets to stream live updates to the map.
With this workflow, you can build powerful, scalable web applications.
FME makes it easy to bring your geospatial data to the web. Whether you want to publish simple vector layers or stream live IoT updates, the combination of the FME Platform and your mapping tool of choice gives you everything you need.
See also:
- [Tutorial] Data Distribution with Web Maps
- [Tutorial] Web Mapping with Mapbox GL JS