Spatial Computing
Spatial computing refers to the use of digital technologies to analyze, visualize, and interact with data in the context of real-world locations and three-dimensional space. It uses spatial awareness, advanced technologies like augmented reality (AR), virtual reality (VR), mixed reality (MR), and extended reality (XR) to link the digital and physical world. Spatial computing helps engineers, planners, and researchers generate, manage, analyze, share, and visualize information spatially. Spatial Computing has historically relied on specialized GIS software packages, such as QGIS or ArcGIS, along with 3D visualization frameworks, but today spatial computing capabilities are found in many database technologies such as Snowflake, Databricks, Postgres, and more. The importance and technology support for spatial data are growing quickly.
Regardless of how the spatial data is stored, traditional workflows using QGIS or other GIS tools are often very effective, but data today is spread across many different systems, and getting a holistic view of the data can involve numerous fragmented, manual steps. Additionally, these workflows require a high level of GIS expertise and take longer to produce large-scale results. An alternative to such GIS packages is low-code frameworks like FME.
This article discusses the basics of spatial computing, its benefits, key applications, and a practical example of spatial computing workflows for processing U.S. Census county-level data.
Summary of key spatial computing concepts
| Concept | Description |
|---|---|
| Spatial computing | The use of computing technologies to create, manage, analyze, and visualize spatial information |
| Spatial computing frameworks | Typical spatial computing workflows require using frameworks in computer vision, 3D visualization, geospatial understanding, and AR/VR. |
| Challenges in spatial computing | • Hardware constraints • Fragmented ecosystem • Complex enterprise integration requirements • Steep learning curve for the programmatic frameworks |
| Low-code/no-code data manipulation | Enable development through configuration and drag/drop interfaces. Reduces delivery time and helps scale engineers quickly. |
| Best practices in spatial computing | • Start with data integration as a foundation. • Build architectures that emphasize standards and cross-platform synchronization. • Prioritize spatial data quality and build systems that support data correction |
Understanding spatial computing
Spatial computing is the use of digital technologies to interact with, analyze, and visualize data in the context of real-world locations and three-dimensional space. It links the digital and physical worlds through spatial awareness, bringing together advanced technologies such as augmented reality (AR), virtual reality (VR), mixed reality (MR), and extended reality (XR).
Core technology components include geographic information systems (GIS), artificial intelligence (AI), spatial databases, and edge and cloud infrastructure. Together, these tools enable users to capture, process, and interpret spatial data.
For example, sensors and IoT devices capture physical-world data, AI processes it for pattern recognition and prediction, and visualization tools like AR or VR display it interactively in 3D environments. Spatial computing requires understanding many complex computing paradigms:
- Computer vision and spatial understanding require knowledge of how visuals are represented and expertise with frameworks like OpenCV, Open3D, etc.
- 3D visualization and simulation require an understanding of point clouds, the formats used to represent them, and frameworks such as PyVista and Panda3D.
- AR/VR requires interacting with data in a 3D plane using frameworks like Apple AR Kit and Google ARCore.
Benefits of spatial computing
Improved customer experience
Spatial computing enables intuitive interaction modes like hands-free, gesture-based, and voice-driven interfaces. It helps users manipulate the physical world as if it were a digital visualization, improving control and immersion.
Such intuitive customer experiences increase customer engagement, which reduces churn and improves customer lifetime value.
Improved decision-making
Spatial computing embeds real-time information into the physical environment through AR/VR interfaces or 3D dashboards. This provides users with a clearer view of relationships among data, objects, and physical space than 2D dashboards do. It helps with faster data understanding and enhances predictive analytics and forecasting.
For example, a warehouse manager can visualize his area as a 3D homographic map showing congestion points, stock shortages, or high temperature areas.
Enhanced employee productivity
By overlaying digital instructions, or checklists, directly onto the physical world, spatial computing helps field employees reduce time spent switching between the digital world and the physical world. It helps speed up learning and onboarding. Real-time spatial guidance can also reduce errors. It can also be used to automate repetitive tasks. For example, in a warehouse, AR-guided stock checks can help locate items quickly.
Digital twins and real-world simulation
Digital twins are software simulations or a real-time dashboard of real-world physical processes, such as manufacturing, chemical reactions, and goods movement. By simulating processes using mathematical equations and presenting the results as an AR/VR interface, digital twins enable employees to experiment with control parameters and view the effects in real time. This helps find an optimal configuration to achieve goals.
For example, a digital twin of a reactor will include AR overlays that provide details on temperature gradients, reaction processes, pressure hotspots, etc., and how the reaction will change if any of the parameters are modified.
Unlocks newer types of apps and business models
By providing an alternative way to represent information and understand data, spatial computing paves the way for new types of apps and business models. With mobile devices that support AR and VR in abundance, it enables the implementation of a hyper-personalized, context-aware experience. It can lead to new business models like spatial commerce, spatial data marketplaces, or digital twins as a service.
Practical applications of spatial computing
Practical applications of spatial computing are rapidly expanding across industries.
Urban planning and smart cities
Urban planning benefits from GIS-driven applications based on 3D city models and urban digital twins. Such applications integrate LiDAR, BI, IOT, and satellite data to model cities in real time. Interactive spatial overlaps can help in evaluating development impacts.
Another key use case is transportation planning, where 3D network data sets can be used for multimodal mobility modeling. Spatial computing using GIS data is also beneficial in infrastructure and construction.
Utilities and energy
Spatial computing can also be used to map underground utility networks, including pipes, cables, and conduits. This helps avoid execution errors and points out areas that need attention. Digital twins for power grids can help with load monitoring, outage prediction, and maintenance planning. A case study on how to use spatial computing for energy and utility network planning can be done using FME, a geospatial computing platform with AR/VR support, available here.
Spatial e-commerce
Geospatial computing enables several advancements in the retail domain. Virtual try-on, which enables customers to try out clothes, glasses, footwear, and makeup using AR mirrors, is the tip of the iceberg. Modern organizations use spatial computing for store planning to simulate 3D shelf layouts and customer flows. AR product previews, which help visualize furniture and home decor in your space, are also a key research area.
Industry 4.0 and manufacturing
Digital twins of factories, with real-time 3D replicas of machines and assembly lines, are made possible by spatial computing. AR-assisted assembly can help workers see instructions overlaid on the machinery, including details of the locations where parts must be fitted. Visualizing sensor data that captures vibration, temperature, etc, is vital in predictive maintenance and early fault detection. In a nutshell, such applications help reduce downtime and increase productivity.
Education and training
Spatial training enables high engagement and retention during complex topic learning while providing safe simulated environments. It can help create immersive lessons that involve 3D visualization. It is very beneficial for skills training, such as welding and lab procedures.
Typical challenges in spatial computing
Being a vast field with several sub-domains, spatial computing engineers face several challenges while implementing production-grade systems.
Hardware dependency and constraints
Spatial computing requires working with a large amount of vector data and can cause problems on lower-grade hardware. Spatial computing requires higher RAM and CPU processing power to accommodate the large vectors in memory and process them.
Fragmented ecosystem
Several fragmented ecosystems exist within spatial computing, and applications developed for one do not work with those for the others. For example, in the AR/VR space, Apple ARKit and Google ARCore are competing technologies. Applications developed for one do not work on others. Likewise, there are several frameworks and software packages in the domain, such as ArcGIS and FME.
Integration with enterprise systems
Spatial computing systems support 3D, real-time, and sensor data, which is very different from the structured data that enterprise systems like CRM, ERP, etc, work with. Often, there needs to be a translation or transformation layer that can be integrated with the APIs provided by enterprise systems.
High learning curve and need for deep engineering expertise
Frameworks and concepts in spatial computing come with a steep learning curve, and programmers often need training to perform spatial computing tasks. People with domain knowledge in the area would need to learn programming in depth to implement spatial computing systems. No-code integration tools like FME reduce the steep learning curve.
Designing intuitive 3D interfaces
Getting the best out of your spatial computing implementations often requires designing an intuitive user interface or AR/VR visualizations to facilitate user interactions. With a multitude of frameworks in this area and very little interoperability among them, this can prove to be a herculean task. Applications like FME Realize can help developers quickly visualize spatial computing data, which can be a lifesaver here.
Implementing a spatial computing workflow
Government agencies, urban planners, businesses, and researchers rely on spatial computing to process and understand spatial information. An example of spatial computing applications is demographic change monitoring, in which spatial operations are performed on spatially aggregated population variables to characterize changes over space and time.
To help clarify how spatial computing is employed in demographic change monitoring, this article presents a case study that tracks decadal county-level population change from 1990 to 2020.
The objective of this case study is to investigate how the US population has changed geographically at the county level every decade from 1990 to 2020 and answer these questions:
- Where were the regions with the highest percentage growth?
- For each state, which were the top 10 counties that experienced consistent population loss over the three decades?
- For each state, which were the top 10 counties that experienced consistent population gain over the three decades?
This analysis provides federal policymakers with key information regarding regional development and the associated inequalities. They can revitalize economies through targeted policy changes or plan for increasing demands for housing, transportation, and public services.
County-level demographic data is available from the US Census, but answering the above questions poses a challenge. It requires setting up and repeatedly executing a complicated set of manual operations, including
- Pulling demographic variables from the US Census using API requests,
- Preparing the data in a structured format,
- Joining the tables with TIGER County Boundary Shapefiles,
- Calculating the percent population change,
- Selecting Counties by criteria (consistent population loss, gain, etc.),
- Exporting to shapefile, geojson, and kml to interactively visualize and export as stylized maps.
This example implements the flow using FME – A data integration platform with support for geospatial data. FME provides a no-code-to-low-code environment for building a spatial computing workflow by connecting GIS and non-GIS operations into a flowchart.
FME is designed to automate manual, repetitive workflows with flexibility. A user without coding can rebuild the workflows above by connecting Census APIs, shapefiles, and calculations through reusable transformers in a visually interactive, low-code interface.
Here is the FME Workbench-based workflow:
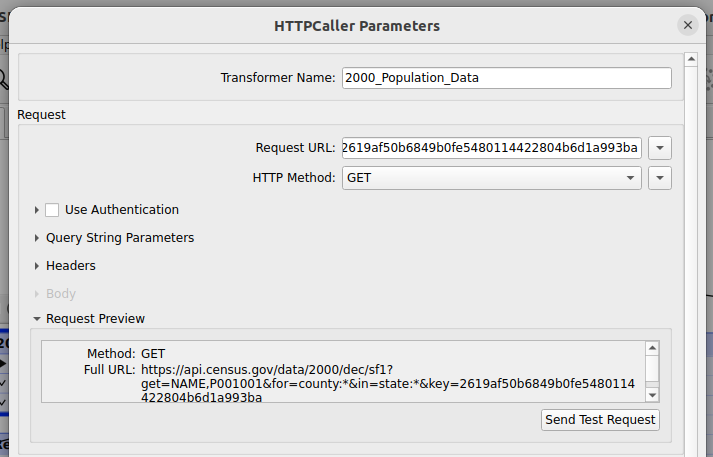
Connect to Census API
Connect to Census API directly using HttpCaller of FME and get the data. We will use the data available at this API – https://api.census.gov/data/2000/dec/sf1. It contains information
about age, sex, households, families, and housing units.
Preprocess data
We need to clean, normalize, and prepare population attributes automatically for calculation.
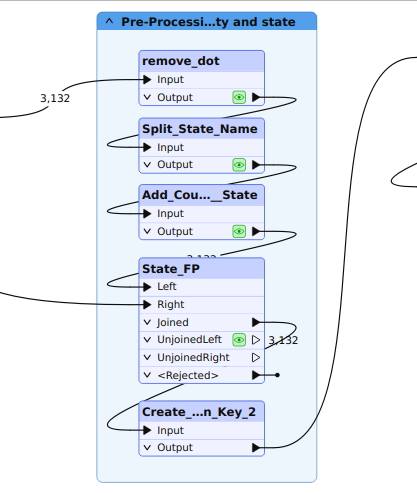
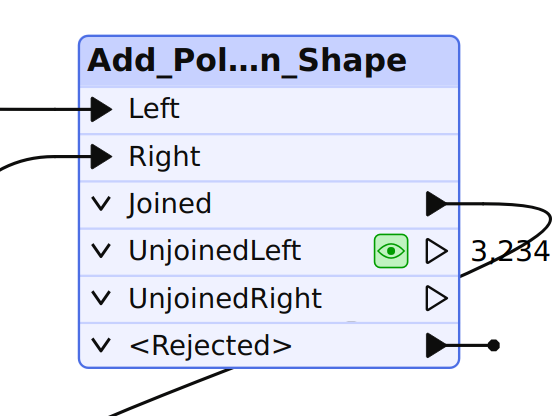
Join to geometries
Link to TIGER county boundaries data using FIPS codes as the joining key.
Calculate rates
Calculate the population change percentage automatically.
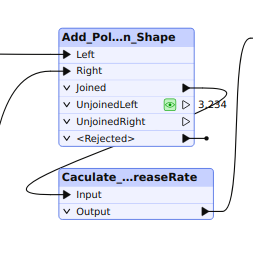
Export outputs
Generate results in Shapefile, GeoJSON, KML, or databases, whatever you want.
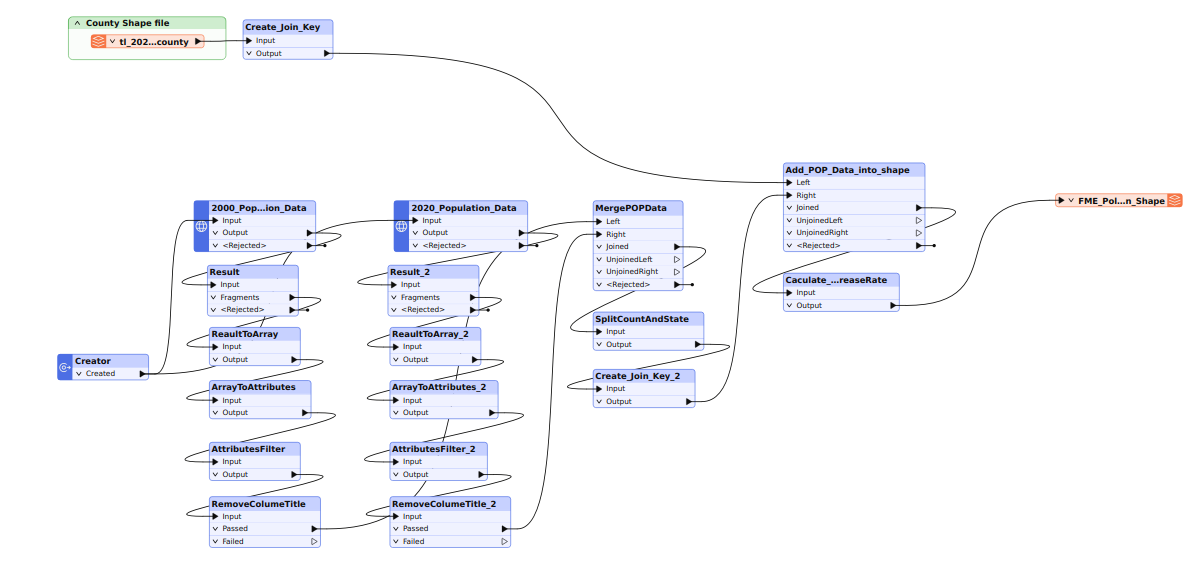
Fig 7: Workflow diagram for FME (HttpCaller → Attribute Cleanup → Joiner → Calculator → Tester/Sorter → Multiple Writers).
Advantages
- Full automation: The users only need to update the parameters and re-run the workflow in a few minutes.
- Low-code/no-code approach: The interactive UI and no-code environments help users build their own workflows, and they reduce or even eliminate the reliance on coding.
- FME is suitable for large-scale, repetitive, or multi-system workflows.
- FME can effectively reduce human error through standardized transformers.
Disadvantages
- The desktop UI is not optimized for interactive analysis and cartographic design tasks.
- The users need to pay for licensing.
Case study results (1990–2020)
Once you build the flow using FME (~6–8 hours of initial setup), rerunning it with new Census data takes under 10 minutes per decade. FME’s strength lies in automating repetitive processes, such as joins and calculations. Once the logic is established, it can be reused without manual reconfiguration, ensuring consistent outputs across decades.
With attribute testers and filters, “consistent loss” is calculated automatically in a single FME pipeline run. Once set up, the total effort is just 10 minutes.
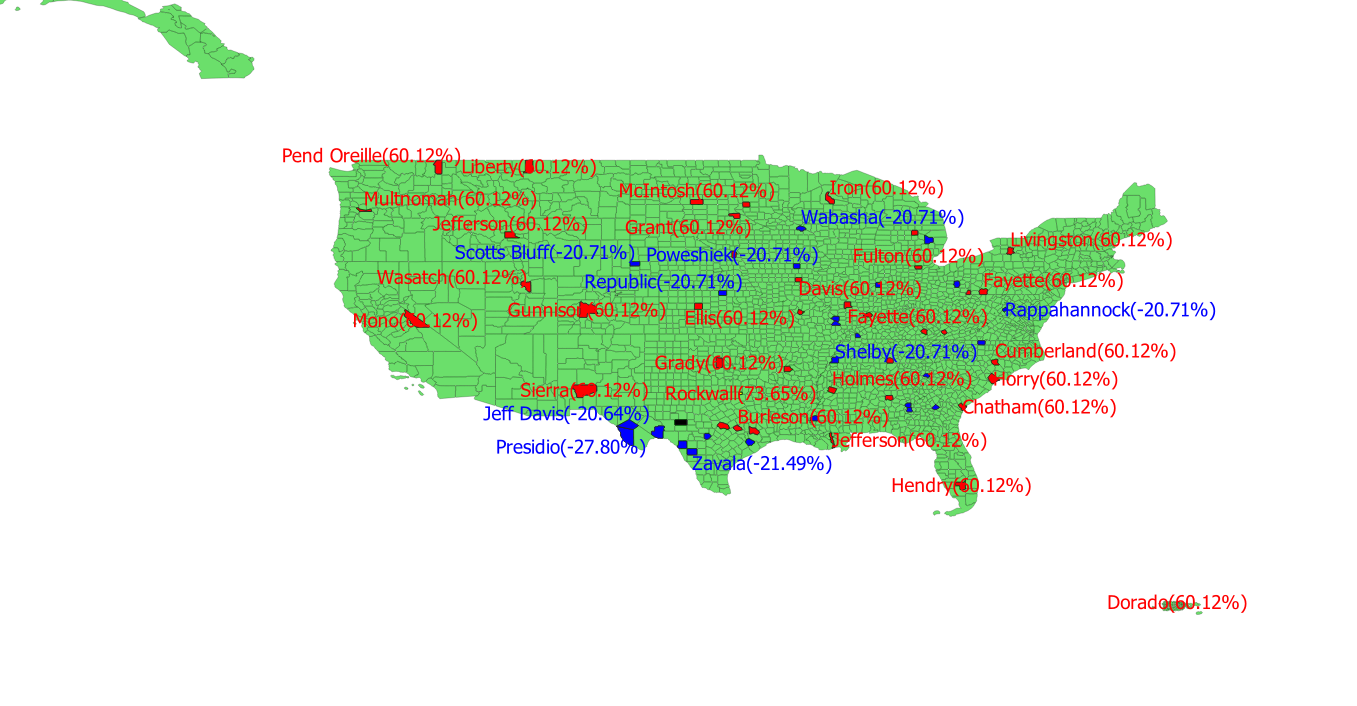
Map visualization of the percent population changes (choropleth map by county, 1990–2020).
The South and West experienced the fastest growth between 1990 and 2020, particularly in metropolitan regions such as Dallas–Fort Worth, Atlanta, and Phoenix. Rockwall County, TX, was among the most extreme examples of population expansion. Persistent population decline was observed mainly in rural Midwest and Great Plains counties (e.g., Schleicher, TX; several in Kansas, Nebraska, and North Dakota). Suburban belts around metros (e.g., Rockwall, Collin, Fort Bend, TX; Forsyth, GA) were found with consistent population gain.
Best practices for spatial computing
Automate wherever possible
Manual data operations such as joins, calculations, and file exports can quickly consume time and introduce inconsistencies. Automation ensures that repeated analyses produce identical results and minimizes human error.
In FME, automation is built into its visual workflow design. Once the transformation logic is set up, the workflow can be executed repeatedly with new datasets or parameters. Tools like Schedulers or FME Server Automations can even trigger workflows when new data becomes available. Automation, regardless of the platform, should focus on eliminating redundancy and improving repeatability while maintaining opportunities for review and validation.
Reusable workflows for new datasets
Reusable workflows are one of the most effective ways to maintain long-term efficiency. Instead of recreating analysis steps from scratch, workflows should be designed to accommodate new data inputs with minimal changes. FME users can leverage parameterized pipelines and published parameters to quickly re-run analyses on updated datasets.
These pipelines can be easily integrated into larger data systems, supporting version control and scalable data processing. By designing workflows that are flexible and modular, analysts ensure that their processes remain relevant even as new datasets, formats, or spatial extents are introduced.
Start with data integration as a foundation
Real-world spatial analysis often requires combining data from multiple systems, such as Census datasets, APIs, databases, online mapping services, or AI services. Integrating external sources strengthens analytical depth and contextual understanding.
In FME, integration is more direct and extensive. The platform supports a wide range of input formats and live connections, such as HttpCaller, OpenAPICaller, Database Readers/Writers, and API connectors. This capability allows spatial workflows to be part of larger data ecosystems that include both GIS and non-GIS data sources. The ability to seamlessly integrate with AI opens up many use cases related to agent development and agentic data engineering. Effective data integration ensures that analyses are not limited to a single dataset but instead reflect a complete and connected spatial picture.
Standardize calculations
Establishing standardized formulas and methods for analysis is critical for reproducibility and data quality. Whether computing population change, density, or growth rates, consistency ensures comparability across years, regions, and datasets.
In FME, standardization can be implemented using Transformers (e.g., AttributeCalculator, Tester) with clearly defined parameters. Once created, these logic blocks can be reused across multiple workflows or shared within teams. Standardization bridges the gap between flexibility and accuracy, helping ensure that insights are based on consistent analytical foundations.
Choose the most suitable tool according to the requirements
There is no single “best” tool; the ideal choice depends on project objectives, data volume, and the desired level of interactivity.
FME is designed for automation, integration, and scalability. It’s ideal for recurring analyses, large data volumes, or environments where datasets need to be processed consistently and efficiently. Its ability to connect APIs, databases, and cloud services makes it a powerful component in enterprise systems (GIS or not).
In practice, many organizations benefit most from using several tools together. For example, one can use QGIS for detailed interpretation and visualization, and FME for automated data preparation and integration. Together, they form a balanced spatial computing ecosystem that combines analytical flexibility with operational efficiency.
Conclusion
Spatial computing is the use of digital technologies to process, interact with, and visualize real-life data in three-dimensional space. It is an amalgamation of several complex technologies, including IOT, AR/VR, computer vision, and geographic information systems.
Working with spatial computing requires a programming background and knowledge of Python frameworks like GeoPandas, Open3D, OpenVista, or GIS frameworks like ArcGIS and QGIS. Getting skilled in all such frameworks requires a steep learning curve. An alternative is to use no-code/low-code frameworks like FME, which offer comprehensive spatial computing features. FME also includes a companion app, FME Realize,that can help with AR/VR workflows.
You can check the platform here.
Continue reading this series
Spatial Computing
Learn the basics of spatial computing and its benefits, key applications, and practical examples for processing spatial data using low-code frameworks like FME and traditional GIS software.
KML To GeoJSON
Learn about converting KML to GeoJSON files, including methods, best practices, and key differences between the two spatial file formats.
Geospatial Data Integration: Best Practices
Learn about the importance of seamless integration of diverse geospatial data sources and the challenges, best practices, and workflows involved in achieving accurate mapping and analyses for decision-making.
Shapefile To GeoJSON: Best Practices
Learn three proven methods to convert shapefiles to GeoJSON for modern web mapping applications.