Skip to content

Conserving mangroves with data integration

MangroveWatch, an international non-profit organization with roots in Australia, is dedicated to the research and conservation of mangroves around the world.

A citizen scientist project

The state of Florida, USA, is home to approximately 600,000 acres of mangrove forests. This diverse wetland ecosystem helps stabilize the coastline, maintains biodiversity, and removes carbon from the environment.

Local community volunteers, in partnership with the Saint Leo University, dedicate their time to collect visual data and contribute as citizen scientists in this ongoing research project.

Using geo-referenced imagery to monitor mangrove shorelines

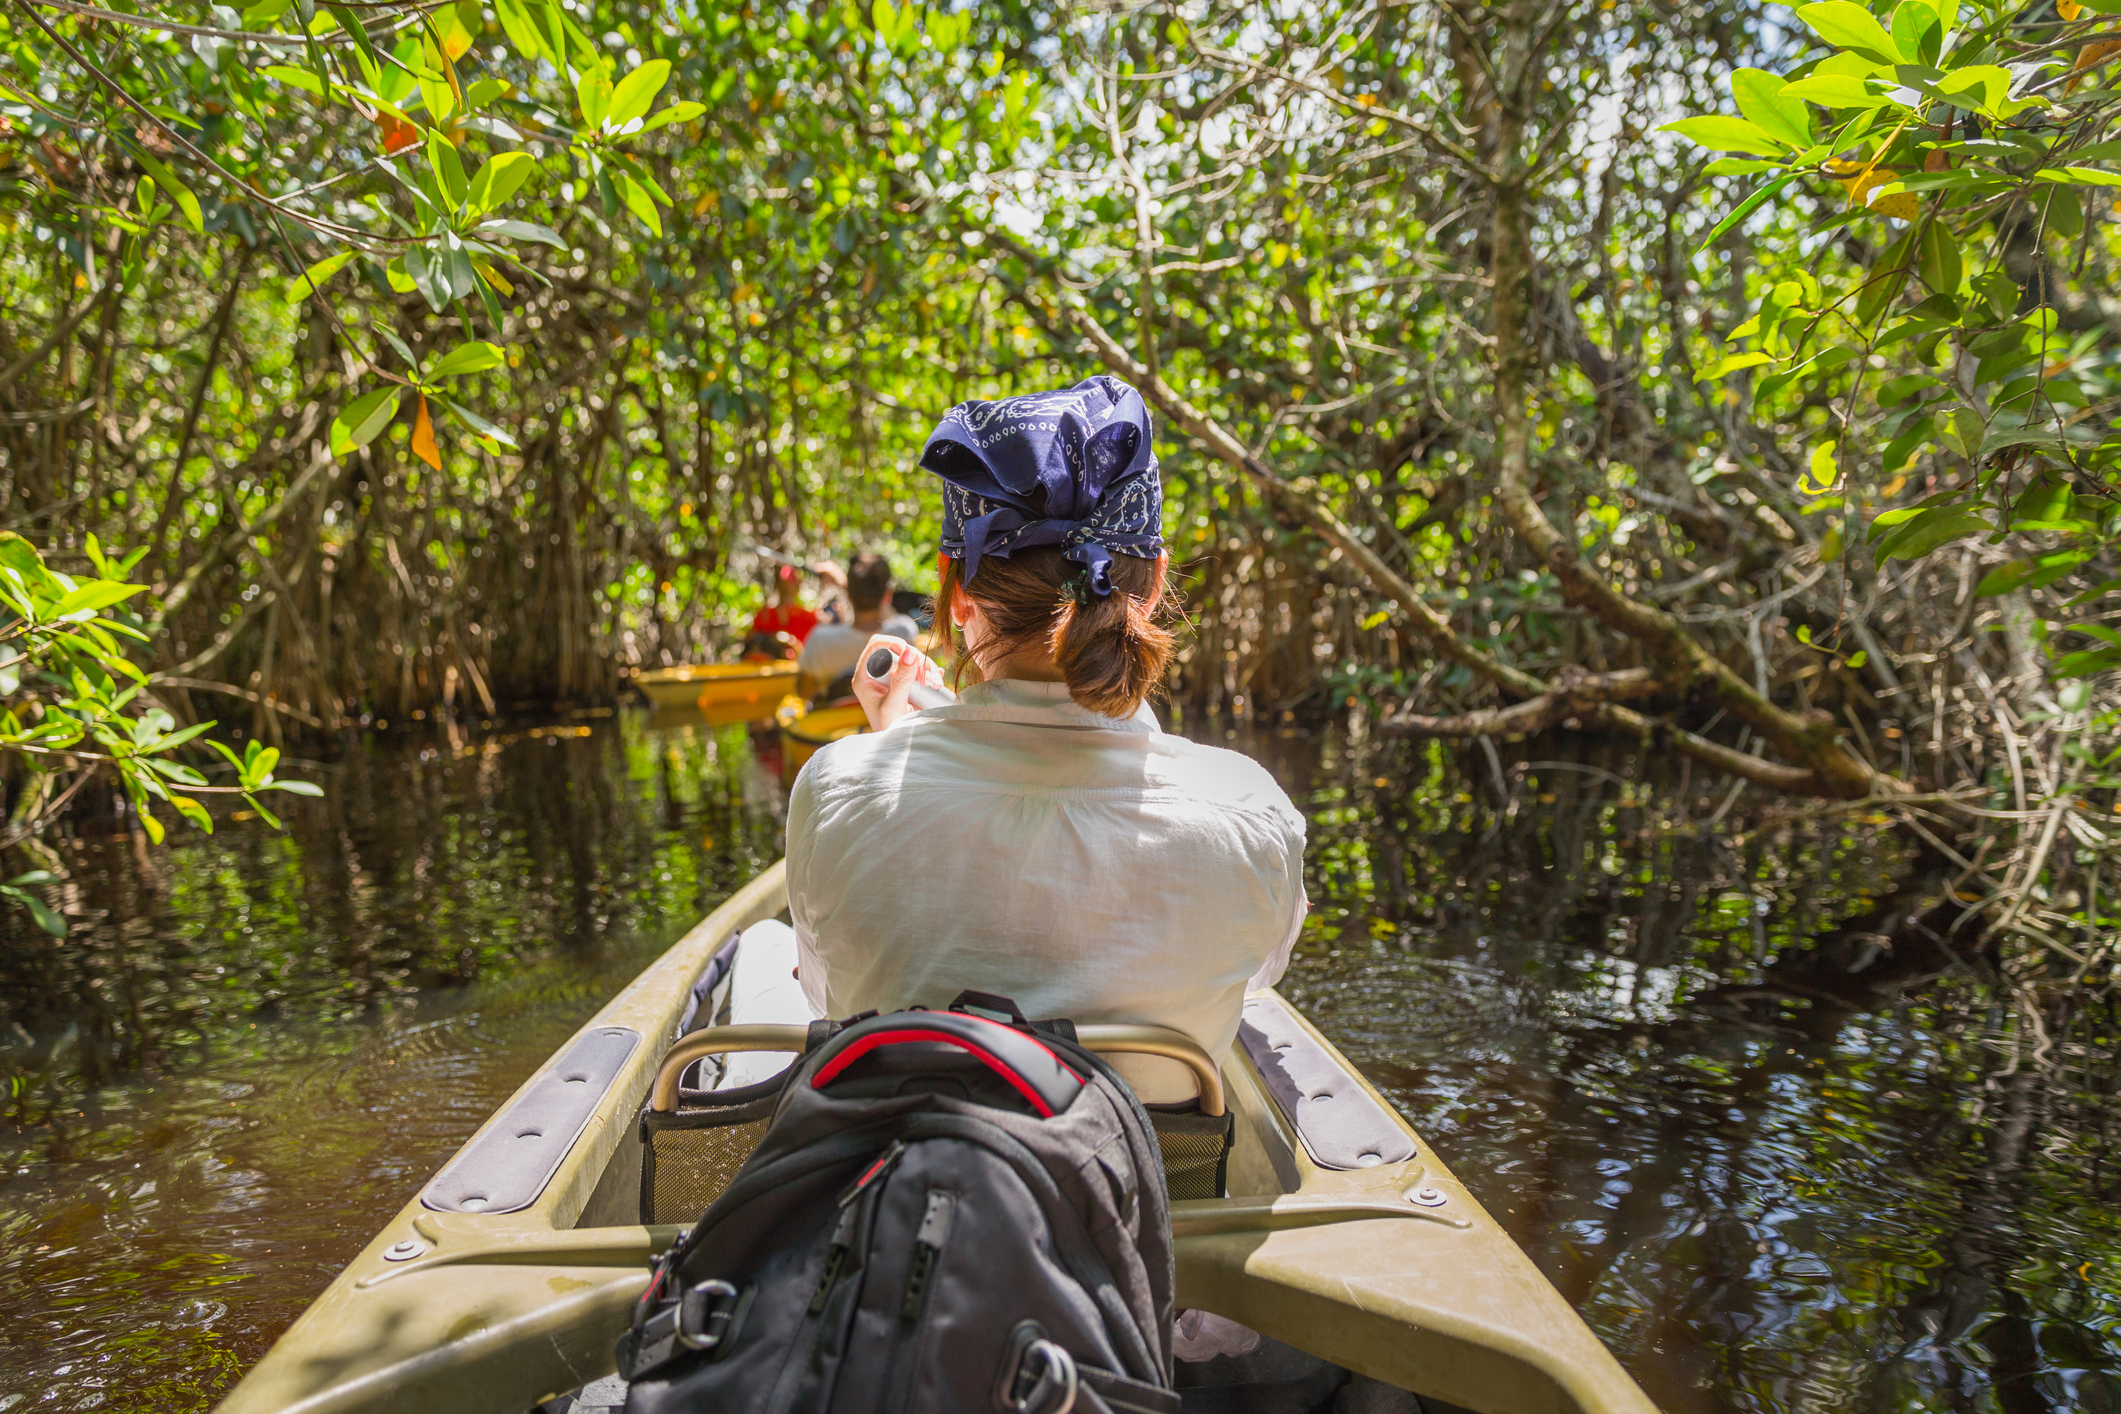
One of the main goals of the project is to produce reports to help scientists visually evaluate changes in shorelines over time. To achieve this, volunteers travel along the shoreline while simultaneously capturing video footage of their path and recording their location. This is sent back to the lab where the video is converted to thousands of one-second still images and matched to a corresponding GPS point. A scientist then reviews this output and shares the final results.

This task proved to be manual, time consuming, and prone to human error. MangroveWatch needed an efficient way to transform videos into a map for easy analysis.
1K+
still frames extracted
5
minutes to complete data preparation
“Prior to our adoption of FME, the process of transforming videos into a map revealing the condition of an area’s mangroves was laborious. What took a day now takes 5 minutes.”
William Ellis
Associate Professor of Biology, Saint Leo University, in partnership with MangroveWatch

Automated data preparation leads to immediate shoreline assessment

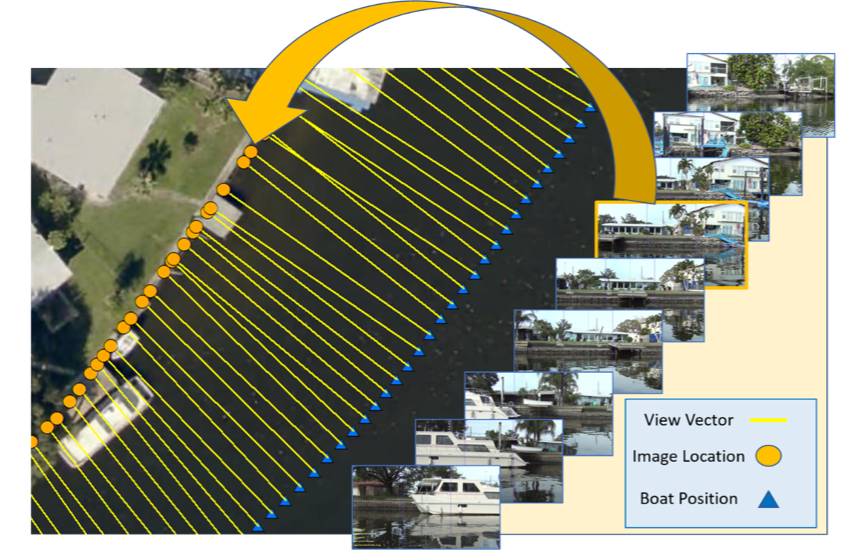
Using FME, MangroveWatch can now complete this task in 5 minutes rather than one day with the click of a button. And, an image is automatically selected to best represent every 10m segment of the shoreline:

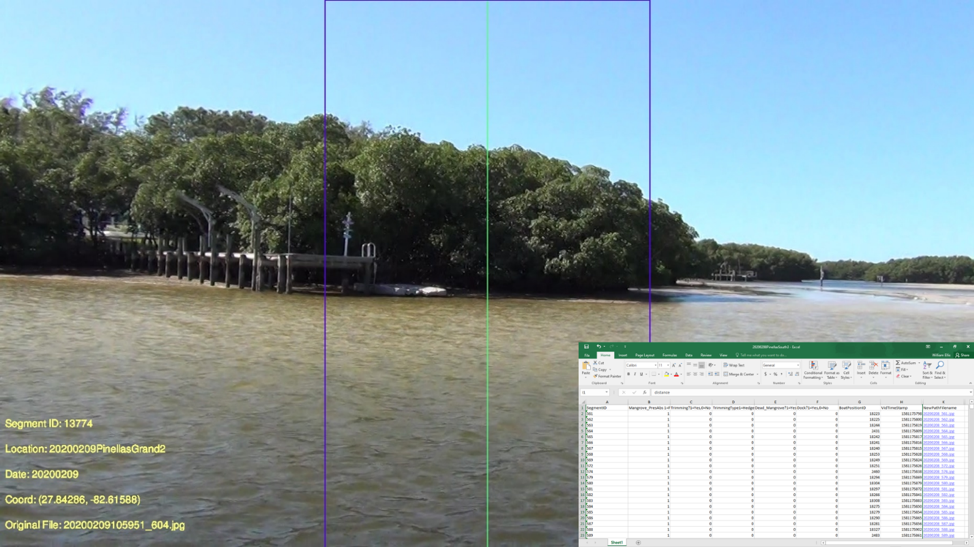
With the best images and relevant metadata in hand, FME presents this information in an organized spreadsheet for easy access and review:

Rather than manually converting and translating all the data, scientists can now focus their efforts on generating a visual report card, evaluate it, and share their analysis with citizen scientists, all within the same day!

Safe product icons
Reach out and get started with FME today

Real change is just a platform away.