Imagine combining hydrographic survey results, real-time marine conditions, and all other available data to generate actionable insights for port decision-makers. In a recent webinar with guests Chad Kimble and Jean-Paul Stafford of T. Baker Smith, we explored this and more.
iBlueHarbor, the technology discussed in the webinar, uses a range of data to power a suite of tools for marine planning, maintenance, and operations. It was interesting to see the processes and datasets involved, plus how FME data integration workflows play a key role in improving efficiency and enabling data-driven decisions.
iBlueHarbor’s Role in Marine Operations
iBlueHarbor is a data analytics service for the maritime sector, blending extensive hydrographic survey results and marine data to deliver analyses and insights. It tackles a range of challenges from vessel clearance calculations to dredging schedules by providing reports in alignment with the port’s bathymetric survey schedule.
The technology is designed to facilitate quick decision-making in marine planning and operations, offering tools for project collaboration, data management across teams, and report generation. It empowers port decision-makers, government and regulatory bodies, marine contractors, private maritime stakeholders, vessel operators, and data analysts, facilitating operations and decision-making.
5 Useful Data Integration Workflows
Here are a few challenges faced by port and marine professionals, plus how iBlueHarbor has built tools to help overcome them. This post provides an overview, but you can watch the webinar to dive into the technical details and workflows involved in creating these solutions.
1. Enable real-time decisions based on current and surveyed data
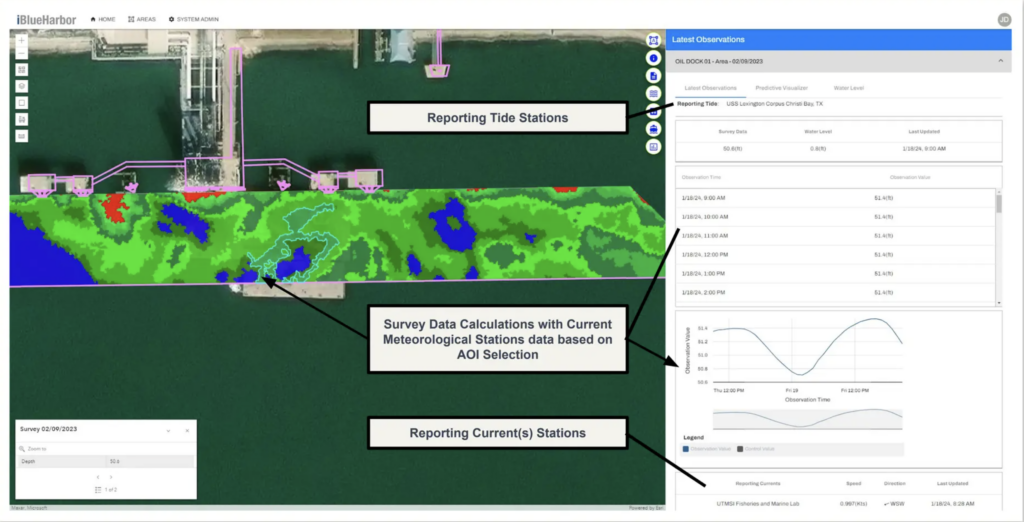
Marine conditions are in constant flux, which means decision-making must take into account a complex set of criteria: nearby observations, currents, tide station data, recent surveys, and more.
iBlueHarbor’s observation tool uses FME to retrieve tide station data every 6 minutes and integrates this with other recent observations. It analyzes trends from the last 72 hours and displays actionable information to the user.
2. Efficient dredging operations
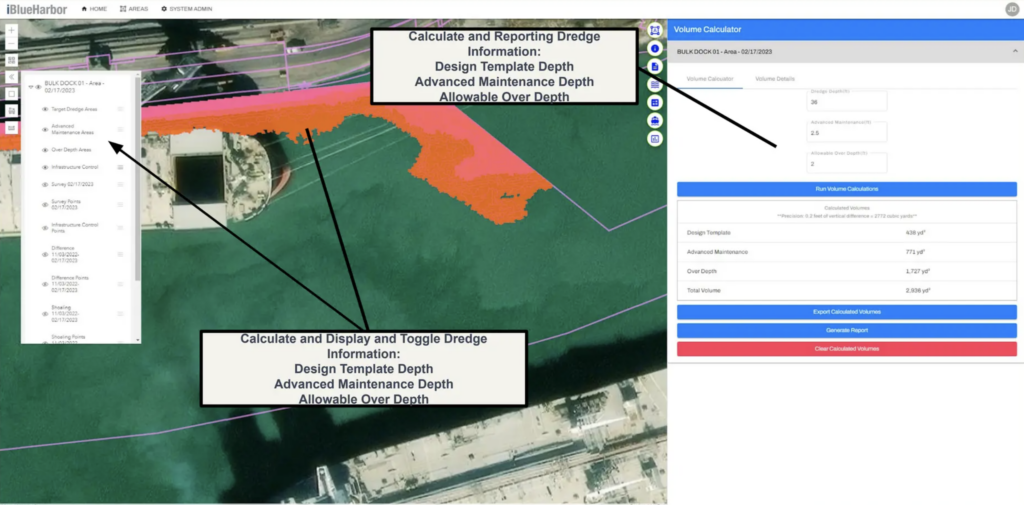
Data is always more useful if it’s actively utilized and processed instead of stored in a silo. In the case of depth data, rather than collecting it only to store it in a static database, it’s better to continuously perform volume calculations on it to inform dredge scheduling.
iBlueHarbor’s tool calculates volumes on depths and returns the yardage, showing if there are any problem areas that need to be dredged and helping to inform planning and scheduling.
3. Determine and display under-keel clearance
Determining clearance involves several factors, including survey depth, current and predicted water levels, and vessel dimensions. For such a complex calculation, a data integration workflow is critical to ensuring accurate results.
iBlueHarbor’s navigational route and area clearance tool displays clearance relative to the survey depth and includes the current and predicted water levels. Users can add new vessels and marine areas for assessment of position and draft issues, as well as import or draw routes, vessels, and areas of interest.
4. Analyze shoaling and scouring data
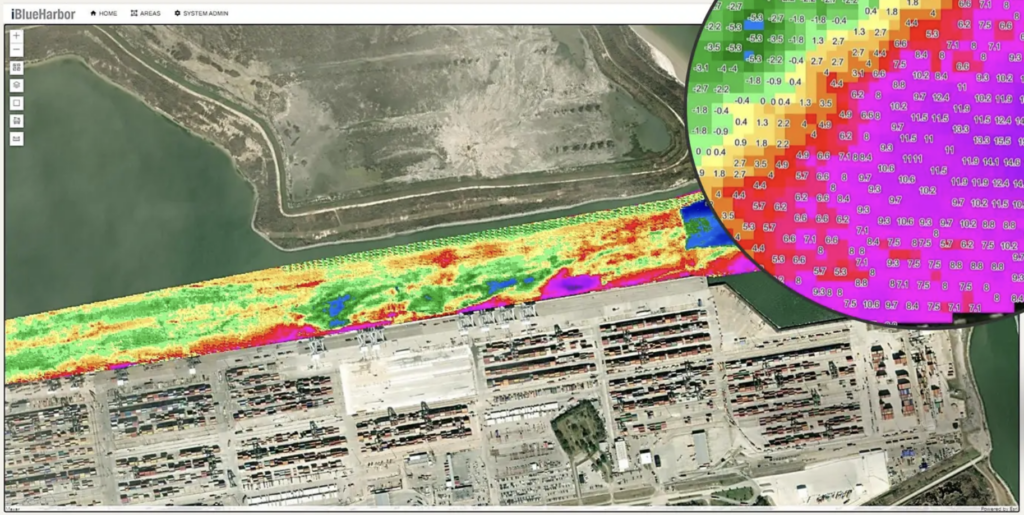
When a survey is completed and imported into the system, it’s helpful to immediately compare it with previous surveys to show the differences. This helps with planning maintenance dredging and ensuring a minimum depth at the dock.
iBlueHarbor’s shoaling and scouring tool analyzes and presents changes in survey data, specifically shoaling rates displayed as a heat map. This shows the situation at the dock between surveys, including color-coded hot spots and contours.
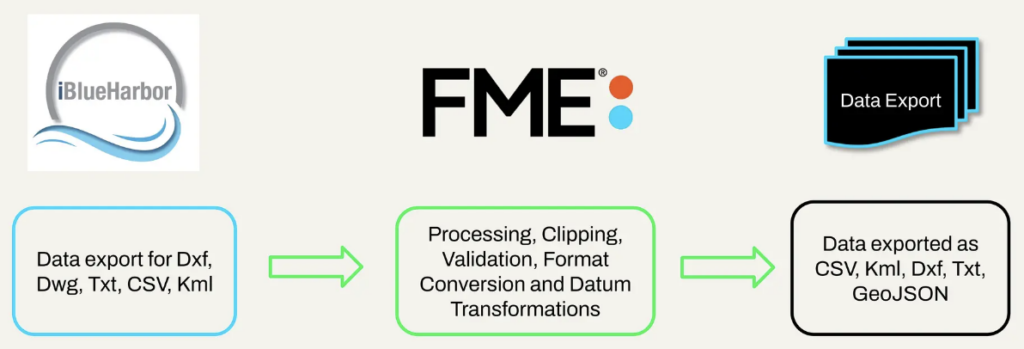
5. Export actionable data and reports
Users need to be able to export data in various formats and generate reports—for example, they could request a vessel access analysis, vessel loading analysis, dredging analysis, or shoaling analysis.
iBlueHarbor leverages FME for these conversions, with an export workflow that allows users to transform data into various formats, and a reporting workflow that can generate reports as PDF, Excel, or text.
“FME is the glue that holds everything together.”
We loved hearing how FME’s data integration and transformation capabilities enable professionals in the port and marine sector to bring data together and create all these great tools. In an environment that requires a scalable, no-code solution for integration, automation, and validation, FME was the perfect fit. We’re excited to see the possibilities for more port and marine tools moving forward!