FME Cloud Tips & Tricks: Delivering a high level of uptime


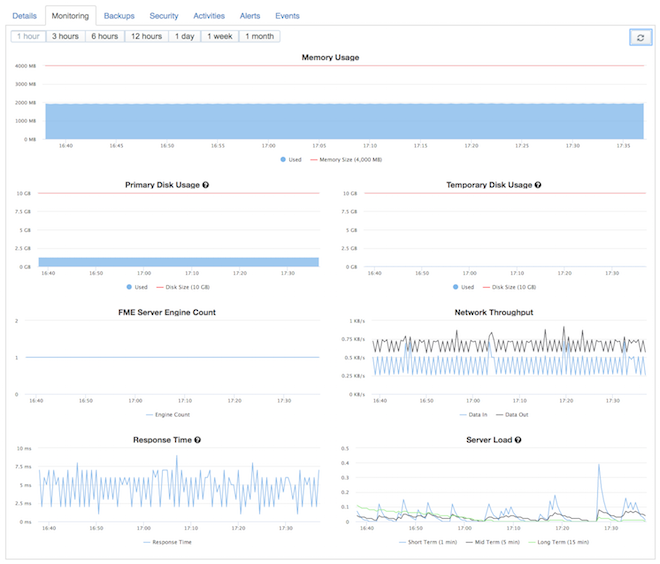
One of the greatest draws of running FME Server on an FME Cloud instance is that you don’t need to worry about hardware, installation, and licensing of FME Server. Once you launch an FME Cloud instance, FME Server is ready to use for you with as many engines as you need. An additional draw of FME Cloud is the monitoring tools that come with it, which make it easy to optimize performance and deliver a higher level of uptime. It can, however, be a challenge to configure these monitoring tools.
Here are the most common incidents that affect uptime and performance of FME Cloud instances, and some actions you can take to provide a high level of uptime on your FME Cloud instances.
Use alerts to detect potential failures as early as possible
The most common conditions compromising the availability and/or performance of FME Cloud instances are:
- The instance runs out of memory
- The server load is too high
- The primary disk is full
FME Cloud provides tools to monitor metrics and create alerts to send notifications once a critical condition is detected.

Set up memory alerts
Memory utilization depends on the specific workspaces you run on your FME Cloud instance. Some workflows are memory intensive (e.g. point cloud processing) while others might not need much memory at all. As a start, you could set up your instance to trigger an alert if memory utilization exceeds 85% for longer than 30 minutes. Setting up memory alerts will require some experience with the workspaces you are running. You might get some false positives at first but this knowledge will allow you to adjust the thresholds without risking downtime of your instance.
Note some workflows will write to the temporary disk once memory is used up. Sometimes this can be exploited to run memory-intensive jobs on FME Cloud instances by extending the temporary disk.
Set a server load threshold
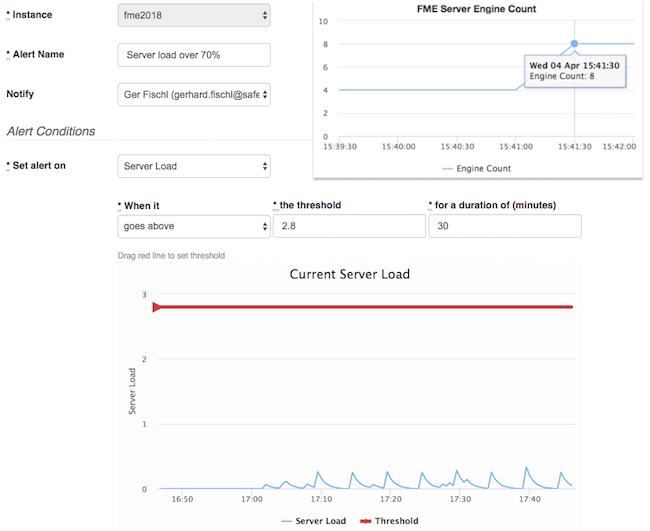
A high server load often comes in combination with a high memory utilization. Also, the more engines you run, the higher the server load will be. To correctly interpret the server load and to set a sufficient threshold for your alarm, it is important to understand the server load metric and its implications regarding the number of cores of your FME Cloud instance. A load of 1.0 means 100% utilization of 1 core. Our FME Cloud Starter instances come with 2 cores and therefore a load of 2.0 indicates full utilization of the 2 cores. For alerts, we recommend starting with a threshold of around 70% utilization for a duration of more than 30 minutes. So let’s say you recently changed increased the engine count on your standard instance (4 cores & 16 GB ram) and want to make sure your FME Cloud instance can handle it. You would set your alert threshold to 2.8.

Manage disk space
When your instance runs out of primary disk space, FME Server will become unresponsive and often won’t be able to recover without rolling back to a previous backup. That’s why the primary disk usage alert (90% usage over 10 minutes) is crucial for a high uptime and is enabled for your instances by default. We also highly recommend storing any data provided by users, that does not necessarily need to persist, on the temporary disk and not on the primary disk. The temporary disk will be purged after every reboot and is also more flexible in resizing. Another very useful tool to prevent running out of disk space is the FME Server System Cleanup.
Response time & Unresponsive server alerts as a final indicator
The response time metric is the final indicator that something is wrong with your instance and that the web user interface might not be accessible for users. If you didn’t disable the default alerts during the launch process, your instance will trigger an alert when the response time is higher than 500 ms for more than 10 minutes or if the server is unresponsive at all. Ideally, you would receive alerts for either high memory, server load, or a low disk space alert before you receive an alert for high response time or an unresponsive server, because often the high response time or not reporting metrics at all is a result of these conditions.
Receiving notifications for instance events
We provide another tool that allows you to detect conditions that might affect the uptime of your instance. Similar to the FME Cloud Alerts, you can specify a Notification Group or a team member of your account to receive notifications for certain events like fatal errors, failed instance actions, and available security updates.
Resolving critical conditions
The benefits of receiving alerts before an instance becomes fully unresponsive are that you can keep your repair times short, and your resolution won’t cause downtime. As long as FME Server is responsive, you can access the Web UI and identify potential jobs affecting the performance and stability of your instance. If your instance is already under such high load that you can’t resolve the issue via the Web UI, a reboot (and in some cases, a rollback to a previous update) might be needed, which you want to avoid.
If there is a time window when uptime is not as critical as usual, for example on a weekend, we recommend you set up an FME Cloud instance schedule to reboot your instance. This will make sure the OS Security updates requiring a reboot are installed and will also free up the temporary disk space of your instance.
Implement a self-healing process
In some cases, it is possible to implement a self-healing process for your FME Cloud instance. For example, in the case of a high response time alert where you can’t access the FME Server Web UI anymore, or if your engine count falls below 1 for over 20 minutes, you could trigger an FME Cloud REST API endpoint to restart the instance when the alert triggers.
The trigger for a workflow like this could be an AWS Lambda function or FME Workspaces that run on a small, dedicated FME Cloud instance. This instance would only run processes triggered by FME Cloud notifications to keep the risk of unexpected events low.


