R, Matey! Adding Statistical Power to FME Workflows


Shiver me timbers! Today be Talk Like A Pirate Day, and our crew be celebratin’ by sharing secrets of FME’s support for RRRRR! This here be the motherload of all statistical analysis, and if ye know the code ye can keelhaul the StatisticsCalculator—
WAIT STOP DON’T LEAVE. I won’t spend the whole blog in a pirate voice, I promise.

What is R?
R is an open source environment and programming language for statistical and graphical computing. It lets you perform advanced calculations and tests and make high-quality plots. To sum up: it’s codey and has a learning curve, but for advanced statistical analysis, nothing beats it.

Now you can connect to R in FME.
FME’s StatisticsCalculator transformer has been around for a long time for all your basic statistics: sums, counts, ranges, mean, median, mode, standard deviation, histograms. It’s useful, but basic — sailing in a jolly boat when you could be on a brigantine!
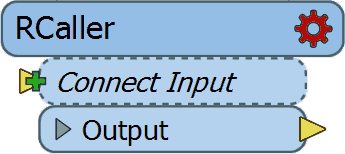
For advanced statistics, we now have the RCaller transformer. This means you can run any R script in the middle of your FME workflow. Integrate any of FME’s supported formats, use R to get advanced stats, tests, and analyses, apply transformations to the data based on the results, and then write the output to any of FME’s supported formats.
Some things you can now do in FME:
- Fast Fourier transform
- Correlation coefficient calculation
- Curve fitting
- Non-linear regression
- Distribution fitting
- Matrix algebra (linear algebra)
- Eigenvalue calculation
- Monte Carlo simulation
3 things to know about the RCaller
 R is under the GPL license, which means we can’t ship it with FME, so you have to install it manually. But once it’s installed you can use it in FME simply by adding an RCaller to your workspace.
- Use data frames to reference the data you want to use in the R script.
- Your script must have an ‘fmeOutput’ value if you want to send it back to FME for further processing.
Example: Create a raster from points via Kriging
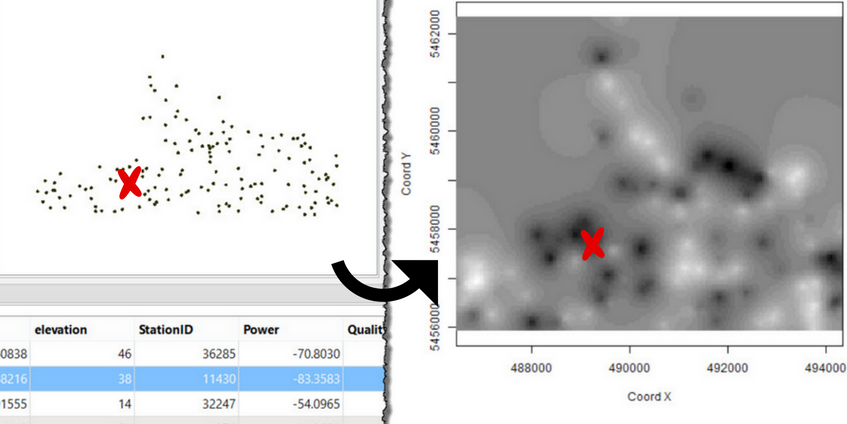
Aye, we’ll be usin’ rigging ter create a map ter buried treasure— oh wait, no. Kriging. We’re using Kriging, an interpolation method, to create a raster surface model from point data. But it’s still a map ter buried treasure, yarrr!

After reading the source points, the FME workflow passes the X and Y coordinates to the RCaller. The RCaller runs an R script to interpolate points into a raster and create a temporary .png file. This temporary raster is then read back into the workflow and can be used for further processing.
- Try it: See the steps and download the workspace on the FME Knowledge Center.
Example: Finding correlations
There are a lot of different kinds of ships. You’ve got rigs, brigs, and brigantines, clippers, galleons, cutters, schooners, then some weird names like Humber Keel and some cool names like Man Of War. Question: is there a correlation between ship structure and speed?
In this example, we have a spreadsheet made by ancient swashbucklers that contains data on all pirate ships in the Spanish Main. We’d like to determine whether there’s a correlation between the number of sails and how fast the ship travelled.

After reading the source CSV (pirates likely recorded this in Microsoft Notepad or vi), the FME workflow passes the NumSails and MaxSpeed attributes to the RCaller, which uses the cor() function to calculate the correlation between these values. That’s it! The result can then be passed along the workflow for further processing.
- Try it: See the steps and download the workspace on the FME Knowledge Center.
*
In closing: Sail ho! Weigh anchor and reef the sails, ye cowardly swabs! Splice the mainbrace and run out the sweeps; thar be loot on that godforsaken isle!
Okay I’m done. Happy Talk Like A Pirate Day.
P.S. Go here for more piracy and an actual pirate map created using FME and Mapnik.


