FME2011 Use Case: Numeric Raster Surfaces

Hi FME’ers,
I know you’ve probably seen examples where a raster elevation model has been transformed into a surface and draped with an appearance; if not you can find some on fmepedia.
However, I created a small example recently that started with a numeric raster – namely a rainfall dataset for the USA – and wanted to share it because I know we have a few users who deal with climate data.
The story here is of a simple process – only two operational transformers – but a whole host of support transformers having to be used to get the data into the correct form. If you have slightly different data you may need fewer of these supporting transformers.
Operational vs Support transformers is something we cover in FME Desktop training.
Starting Data
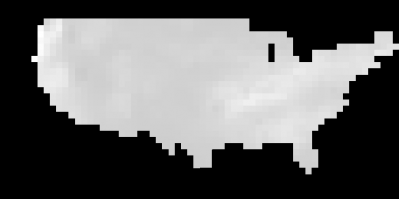
The starting data is visually unprepossessing (dull), even when interpreted in the FME Viewer:
Query a cell and you find that it is simply an X/Y location with a rainfall value (type REAL32):
I got this data from the NOAA Climate Prediction Center.
Creating a Surface
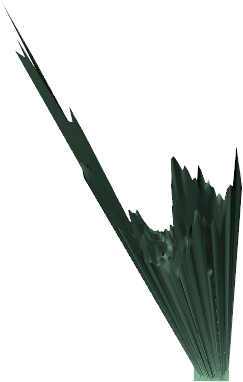
The key task is to create a surface, and this is done with the first operational transformer, the TINGenerator. With raster as the POINTS input port, the TINSURFACE output port returns this data:
OK. There’s a scaling problem because the X/Y is in Lat/Long, whereas the Z is in rainfall units (inches?). So the Y values span 24 units, but Z values 240.
So, in goes a Scaler transformer to scale back the Z values, and also a RasterExpressionEvaluator to filter out values -999 which represent raster “nodata”. The expression used (in case you want to know) was:
if(A[0]==-999 , 0, A[0])
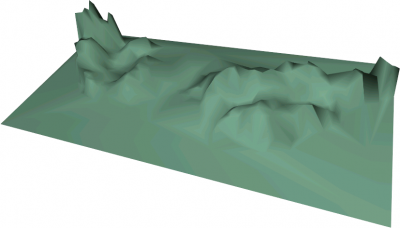
This gives us a nicely smooth surface representing US rainfall:
Man! I’d hate to live anywhere near Seattle. Oh…
Adding an Appearance
To make the surface a little more exciting, I could drape a map image or similar onto it. That would be done with the second operational transformer, the AppearanceAdder.
So this workspace could be as simple as two readers (one data, one image), a TINGenerator, and an AppearanceAdder; plus a writer of course.
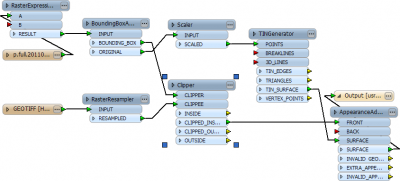
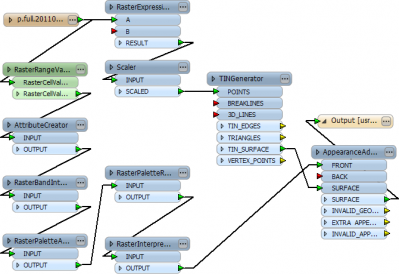
In my case, the raster image covers a larger area than the data so I will extract the data area with a BoundingBoxAccumulator, and use that as the clip boundary in a Clipper transformer. The output from this will be the image to be draped. The workspace now looks like this (click to enlarge):
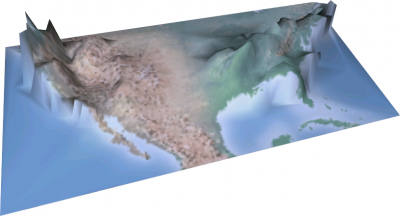
The output now looks like this:
You can see that the image I used was a relief map. I got it from NaturalEarthData.com
Coloring by Rainfall
The other thing that users might want to do is color the surface according to rainfall amount, and not use a map image. I achieved this by using a palette on a copy of the data, and applying that as an appearance.
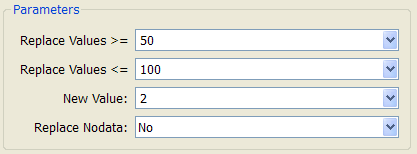
A palette can’t be defined with a range so the data needed to be classified. Looking at the data, I could see rainfall ranged from 0 to 230, so five classes of 50 units each seemed appropriate. Firstly I used a set of RasterCellValueReplacer transformers to define the five classes. Here values between 50 and 100 become class 2 cells.
An AttributeCreator creates the palette (where Class 2 = Color 0,255,0), and a RasterInterpretationCoercer is used to coerce the source from Real32 to UInt32 (you can’t put a palette on ‘real’ data for some reason).
A RasterPaletteAdder copies the palette from the attribute to the raster, and a RasterPaletteResolver applies it to give the data color. A final RasterInterpretationCoercer is used to tell FME the data is now an RGB24.
The workspace now looks like this, where the Custom Transformer is simply the five RasterCellValueReplacers packaged up nicely (click to enlarge):
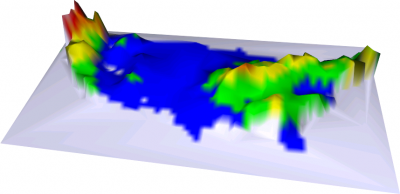
And the output now looks like this:
The output, by the way, is a 3D PDF file (but then you had probably guessed that).
Other Ideas
There’s a ton of other functionality and ideas that could be applied here. Firstly a vector outline round the border (fairly simply with the VectorOnRasterOverlayer). But secondly, you could blend the color output onto the relief map so that you saw both color and relief; think about this example from Dmitri applied as a surface appearance:
Conclusion
I only created this workspace in order to generate a surface for use as a training manual screenshot! However, it turned out so well, and in such short a time, that I thought I would share it. You can find the workspace and data on fmepedia
Because the data is relatively small (a resolution of 1 degree per cell is only a 64×32 cell raster) the whole process of surface generation and appearance draping takes just 3 seconds to run; and it does work well as a PDF output (a larger output would not).
Anyway, the point was to take a numeric raster (other than a DEM) and create a textured surface out of it, and I think the results are quite impressive. If you have similar data, give it a try.
Regards

