Using the Twitter Stream API to Visualize Tweets on Google Maps


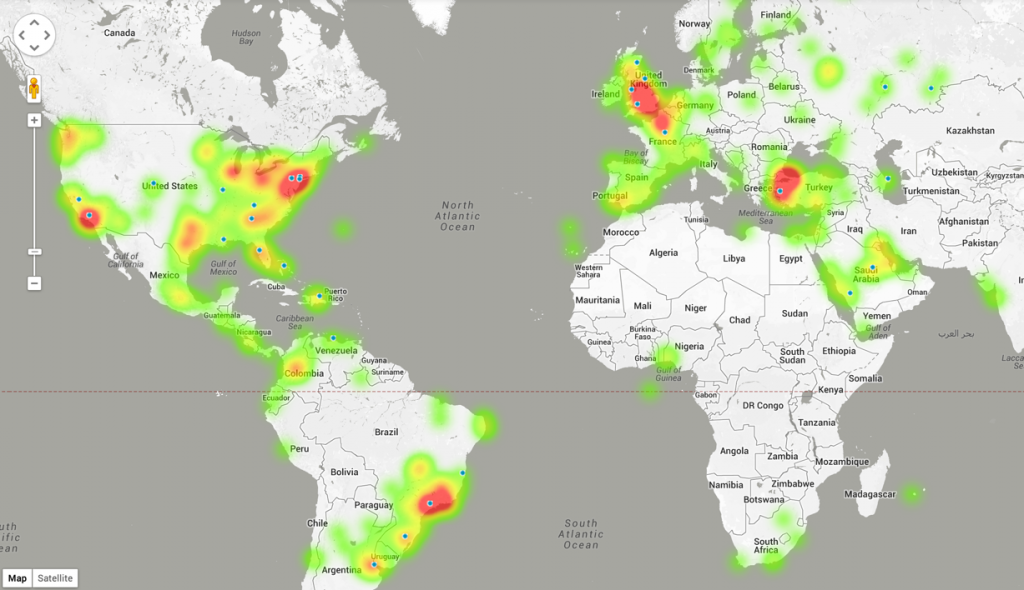
This post will walk through how to stream geotagged tweets onto a Google Map using Node.js. The end result is a real-time heat map depicting where in the world people are tweeting from.
Step 1 : Coding the Application
The application can be downloaded in full from Github. It has two main parts: the server-side code running on Node.js, and the client-side code running in the browser. The server requests the Tweets from Twitter, parses them and then streams them out via WebSockets to anyone with the web page open. Before we start:
- Ensure Node.js is installed.
- Download and unzip the project from GitHub.
- Open a command window and cd into the directory.
Server-side code
Two files power the server side: package.json and server.js.
Package.json holds a variety of metadata related to the project and lists dependencies.
Server.js is where all of the logic lies. This code first sets up a web server using express, which serves the static web pages, loads socket.io the web socket module, and loads the Twitter API module.
//Setup web server and socket
var twitter = require('twitter'),
    express = require('express'),
    app = express(),
    http = require('http'),
    server = http.createServer(app),
    io = require('socket.io').listen(server);

//Setup twitter stream api
var twit = new twitter({
  consumer_key: '',
  consumer_secret: '',
  access_token_key: '',
  access_token_secret: ''
}),
stream = null;

//Use the default port (for beanstalk) or default to 8081 locally
server.listen(process.env.PORT || 8081);

//Setup rotuing for app
app.use(express.static(__dirname + '/public'));

//Create web sockets connection.
io.sockets.on('connection', function (socket) {

  //Code to run when socket.io is setup.

});
To use the API, you must create an application on Twitter. It’s free and it doesn’t take long. Once you have created your application, load it from the dashboard and then click on API keys tab at the top. The values in the web interface correspond with the following in the JSON:
- API key > consumer_key
- API secret > consumer_secret
- Access token > access_token_key
- Access token secret > access_token_secret
After that, the interesting part starts:
//Create web sockets connection.
io.sockets.on('connection', function (socket) {

  socket.on("start tweets", function() {

    if(stream === null) {
      //Connect to twitter stream passing in filter for entire world.
      twit.stream('statuses/filter', {'locations':'-180,-90,180,90'}, function(s) {
          stream = s;
          stream.on('data', function(data) {
              // Does the JSON result have coordinates
              if (data.coordinates){
                if (data.coordinates !== null){
                  //If so then build up some nice json and send out to web sockets
                  var outputPoint = {"lat": data.coordinates.coordinates[0],"lng": data.coordinates.coordinates[1]};

                  socket.broadcast.emit("twitter-stream", outputPoint);

                  //Send out to web sockets channel.
                  socket.emit('twitter-stream', outputPoint);
                }
              }
          });
      });
    }
  });

    // Emits signal to the client telling them that the
    // they are connected and can start receiving Tweets
    socket.emit("connected");
});
Let’s walk through the steps.
- The client mapping application connects to the web socket server and triggers the connection listener.
- Another listener, start tweets, is set up and a connected message is sent to the client telling them they are connected and everything is ready.
- When the client receives this message, it sends a message to the start tweets listener and the Tweets get streamed. We only want to stream Tweets with location, so they are parsed, and if they have coordinates we create a simple piece of JSON containing the location. Note we also have to check if there is a stream open, as we don’t want to open one stream per connection (the Twitter API has a cap on the number of streams you can open. From testing, I think it is around 6).
One thing to understand is that every time a client connects, they will create a new connection process. All these connection processes will, however, share the objects outside of the connection listener.
Client-side code
The webpages are all served from the public folder. The index.html file loads the relevant js libraries and then there is a tag for the Google Map. The twitterStream.js is where the logic lies.
  var map = new google.maps.Map(document.getElementById("map_canvas"), myOptions);

  //Setup heat map and link to Twitter array we will append data to
  var heatmap;
  var liveTweets = new google.maps.MVCArray();
  heatmap = new google.maps.visualization.HeatmapLayer({
    data: liveTweets,
    radius: 25
  });
  heatmap.setMap(map);

  if(io !== undefined) {
    // Storage for WebSocket connections
    var socket = io.connect('http://localhost:8081/');

    // This listens on the "twitter-steam" channel and data is
    // received everytime a new tweet is receieved.
    socket.on('twitter-stream', function (data) {

      //Add tweet to the heat map array.
      var tweetLocation = new google.maps.LatLng(data.lng,data.lat);
      liveTweets.push(tweetLocation);

      //Flash a dot onto the map quickly
      var image = "css/small-dot-icon.png";
      var marker = new google.maps.Marker({
        position: tweetLocation,
        map: map,
        icon: image
      });
      setTimeout(function(){
        marker.setMap(null);
      },600);

    });

    // Listens for a success response from the server to
    // say the connection was successful.
    socket.on("connected", function(r) {

      //Now that we are connected to the server let's tell
      //the server we are ready to start receiving tweets.
      socket.emit("start tweets");
    });
  }
This sets up the Google Map then opens up a websocket connection with the server. Once the server confirms it has received the connection and is ready to start sending Tweets, the connected listener is called and the client sends a message back to the server to say it is ready via socket.emit(“start tweets”);. The server responds with a stream of Tweets captured in the twitter-stream listener, where they are added to an array bound to a Google Maps heat layer.
Step 2: Running the Application Locally
First we need to install the dependencies (defined in package.json). From the terminal, cd to the project directory you downloaded so you are in the same folder as server.js. Then do:
npm install
To run the server, do:
node server
You should then be able to open a browser and access http://localhost:8081.
To host the application this we used AWS Elastic Beanstalk. The GitHub read me walks through how to deploy the application.
Improving the Application
How do we take this further? It would be great to dig deeper into the incoming data and rather than just visualizing the data explore trends and gain intelligence. I also wonder what happens if we want to mashup different data sources and read data from other web services or lower-level protocols, such as TCP/IP or WebSockets.
Things get very complicated very quickly when writing code. Here at Safe Software, we don’t think you should have to worry about server-side code to solve your problems—that’s our worry. Here is exactly the same example as above without writing one line of server-side code. All of the workflows and logic are built in a graphical user interface and can then be turned into services and hosted on our cloud platform.

Want to learn more? Watch our free webinar on How to Intelligently Process and Deliver Real-Time Data with FME Server.
Try it Now
We’re here to help you create harmony between your data and applications. We have lots to help ensure your trial is a success including weekly webinars, free training, and full support even during trials.


